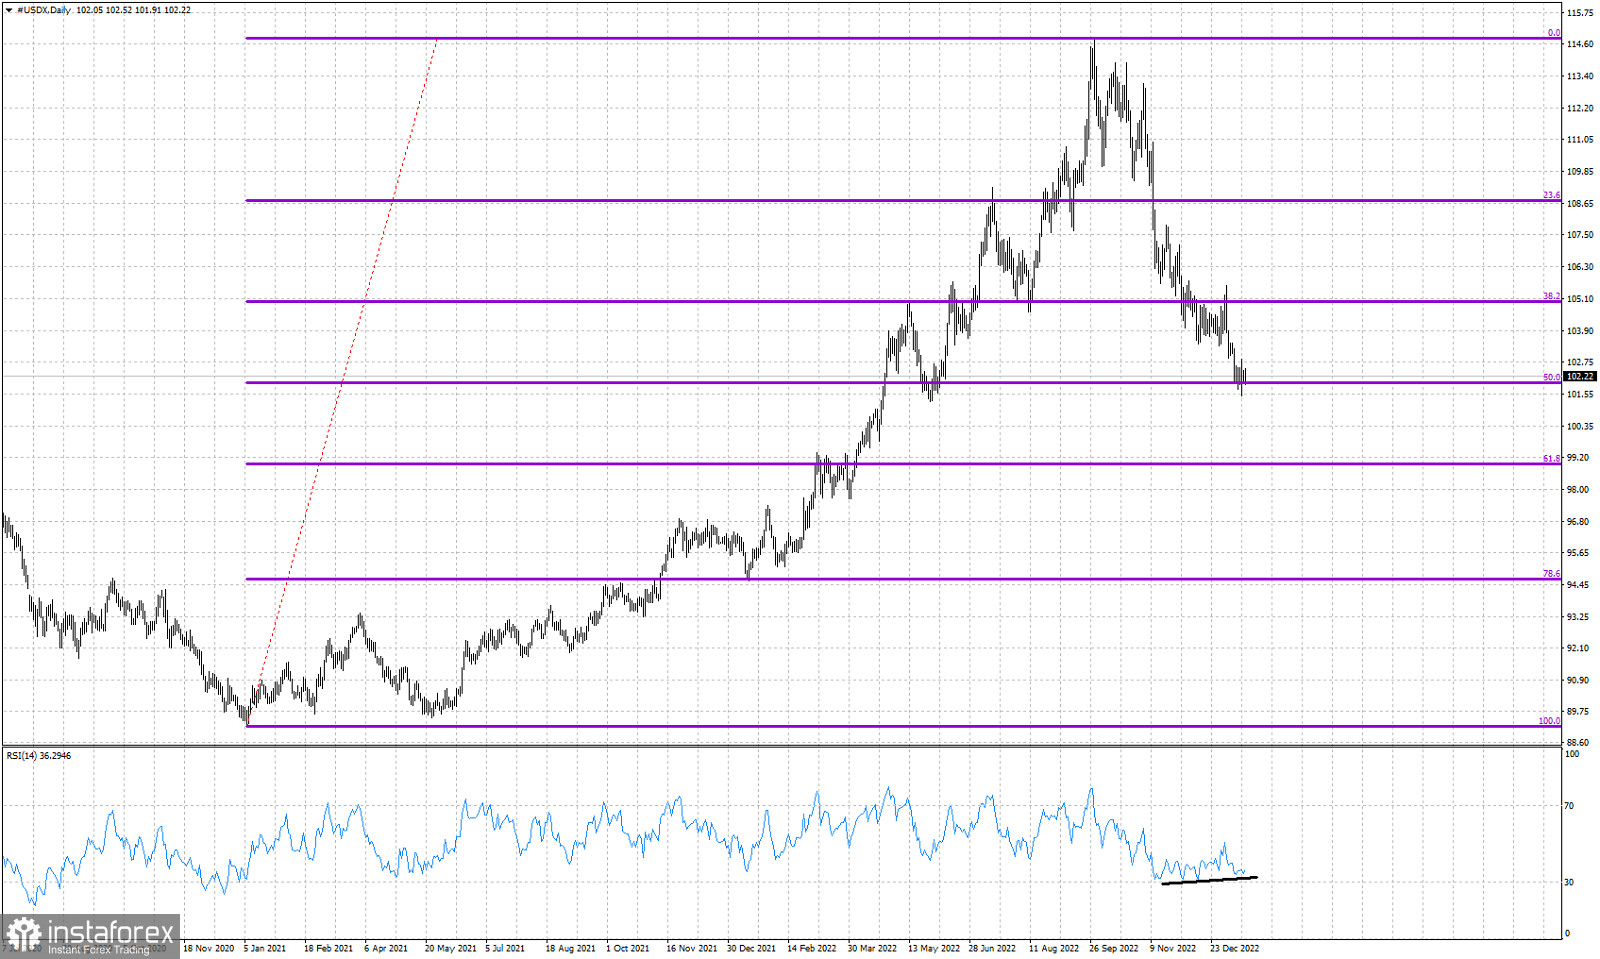
Violet lines- Fibonacci retracements
Black line- bullish RSI divergence
The Dollar index is trading around 102. Price has stopped the decline at the 50% Fibonacci retracement of the entire rise from the 89-90 base to the 114.70 highs. Technically short-term trend remains bearish. The RSI is providing bullish divergence signals in the Daily chart but this is not enough. Price must start a sequence of higher highs and higher lows in order for bulls to hope for a bigger reversal. So far price continues making lower lows and lower highs. Next major support is found at the 61.8% Fibonacci level. However before moving towards that level, at least a short-term bounce is expected.
 English
 Русский
 Bahasa Indonesia
 Bahasa Malay
 ไทย
ไทย Español
 Deutsch
 Български
 Français
 Tiếng Việt
 中文
中文 বাংলা
বাংলা हिन्दी
 Čeština
 Українська
 Română

