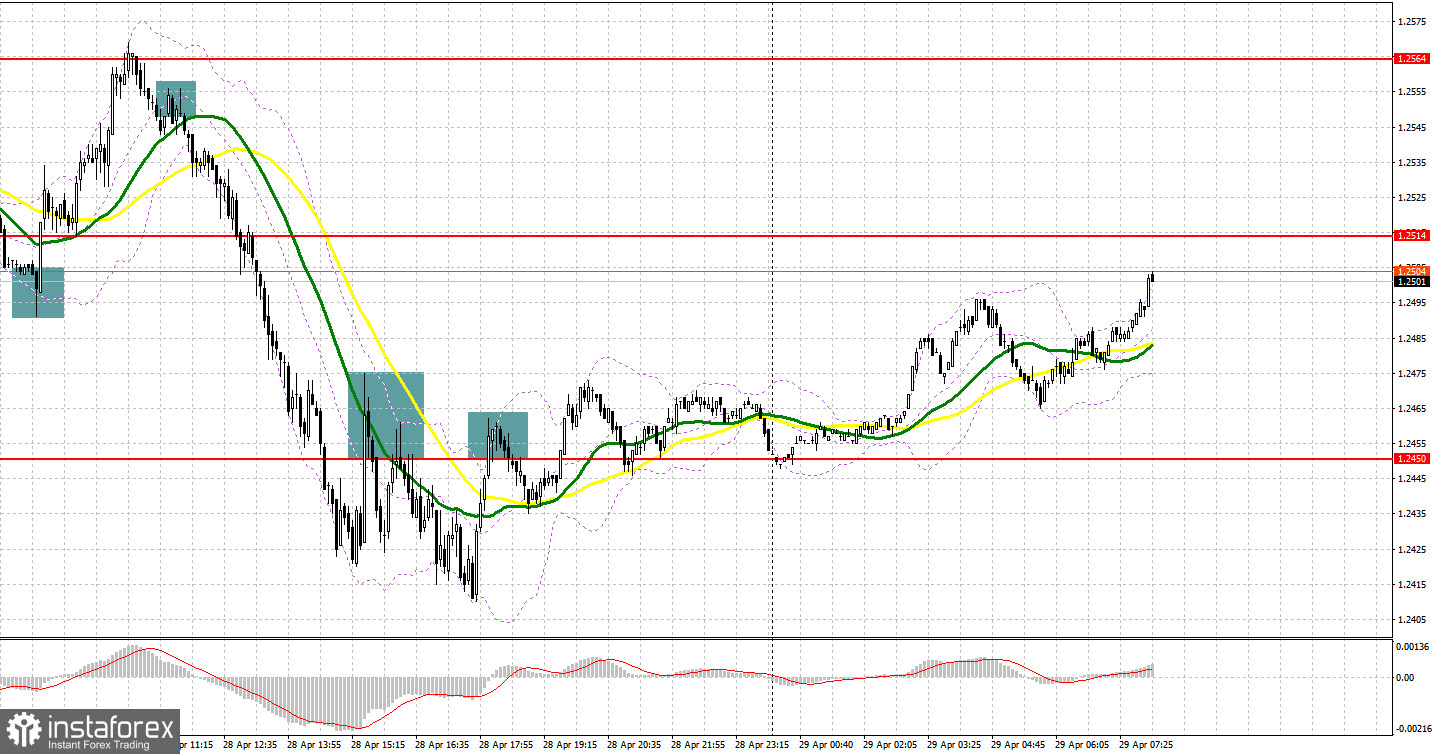
Yesterday, there were several excellent entry points. Now let's look at the 5-minute chart and try to figure out what actually happened. In the morning article, I highlighted several important levels and recommended taking decisions with this level in focus. The unsuccessful attempt of the bears to push the pair below 1.2504 and a false breakout generated a buy signal. The pair quickly returned to the nearest resistance level of 1.2550, bringing about 40 pips of profit. However, bears picked up steam and attacked this level once again. A false breakout of 1.2550 led to a drastic drop of GBP/USD, allowing traders to get about 40 more pips. Unfortunately, the bulls failed to defend the 1.2504 level for the second time, although a good entry point into long positions appeared there. In the afternoon, the bears took the lead, pushing the pair to 1.2450. An upward test of this level gave an excellent entry point into short positions, which resulted in another drop in the pair by more than 40 pips. At the end of the US session, the bears again tried to make a false breakout, but it did not trigger a downward movement.

What is needed to open long positions on GBP/USD
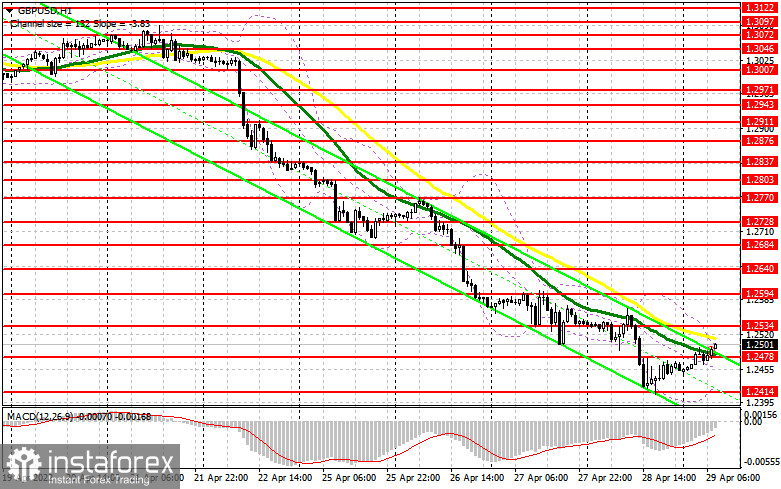
A strong upward correction is being formed for the pound sterling at the end of this month. So, traders who want to buy GBP/USD at the lows need to pay attention to this fact. A sharp shrink in US GDP by 1.4% in the first quarter of this year after an increase of 6.9% at the end of last year surprised traders yesterday but did not affect the trajectory of the US dollar. Yet, demand for the US currency significantly decreased. This is another reason why the oversold pound sterling may regain ground. Besides, bulls may take the upper hand at the beginning of next month if the Bank of England takes a more aggressive stance on monetary policy. Today, there could be a false breakout of the support level of 1.2478. If so, it will be a good signal to open long positions. There are also moving averages there that are passing in the positive territory. If the bulls manage to break through this level, then it will indicate that the pair is trying to hit the bottom. After that, there is a high chance that it may approach 1.2534. A break and consolidation above this level with a downward test will give an additional entry point into long positions. The pound sterling is expected to rise sharply to 1.2594 where I recommend profits taking. The price is sure to climb higher provided that there will be no economic reports for the UK today. They have recently only caused new drops in the pair. A breakout of 1.2594 will open the way to 1.2640. If the pair declines and bulls show no activity at 1.2478, it is better to cancel long positions until the next support level of 1. 2414. It is crucial to wait for a false breakout as the next test of this level may undermine the bullish correction that may occur at the end of the month. It is possible to open long positions immediately for a rebound only at 1.2369 and 1.2321, keeping in mind an upward intraday correction of 25-30 pips.
What is needed to open short positions on GBP/USD
The main goal of the bears today is to push the pair to the nearest support level of 1.2478. If they succeed, they will regain control over the market. A breakout and an upward test of 1.2478 will offer a sell signal. GBP/USD is likely to dive down to 1.2414 where traders will be reluctant to open long positions. A breakout of this range will strengthen the bear market. The nearest target level will be a low of 1.2369 where I recommend profit-taking. A more distant target will be the 1.22321 level but it is too early to talk about it now. If the GBP/USD pair climbs, the bears will try to do everything possible to prevent its consolidation above the resistance level of 1.2534. Such a move will strengthen the upward correction and lead to the demolition of sellers' stop orders. A false breakout there will give an excellent sell signal. If bears show no energy at 1.2534, the bulls will try to push the pound sterling even higher. If this assumption is correct, it is better to cancel short positions until the next resistance level of 1.2594. I would also advise you to open short positions there only in case of a false breakout. It is possible to sell GBP/USD immediately for a rebound from a high of 1.2640, keeping in mind a downward intraday correction of 30-35 pips.

COT report
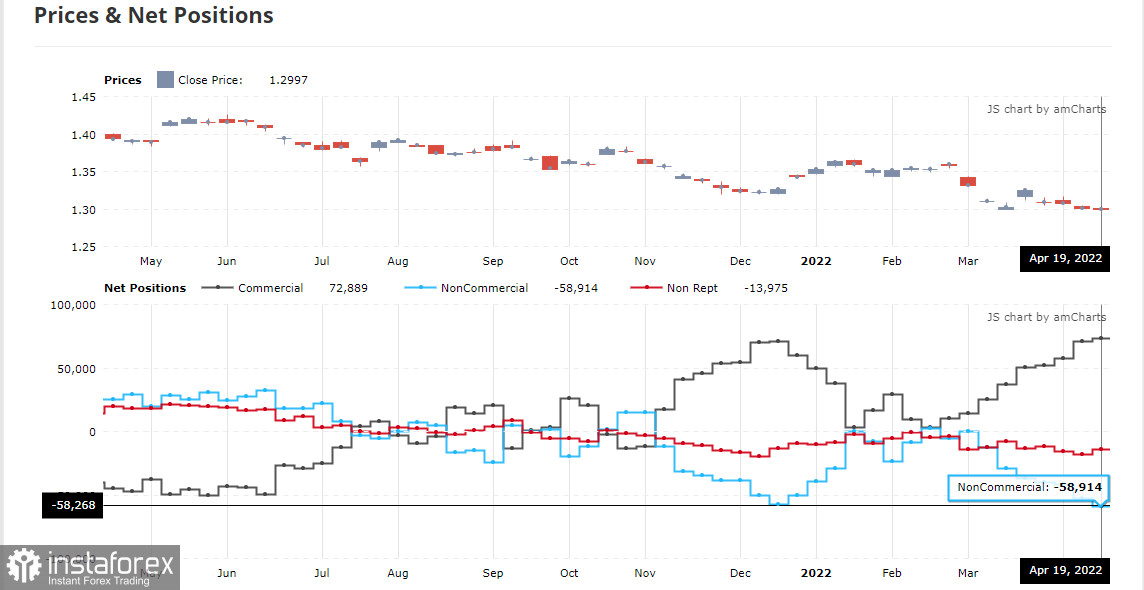
The COT report (Commitment of Traders) for April 19 logged an increase in both short and long positions. However, the number of short trades exceeded the number of long ones. It is clearly visible on the chart. The economic situation is now pretty grim in the UK. Last week, BoE Governor Andrew Bailey confirmed it. His statements that the economy was heading towards recession turned out to be the last straw that triggered a sell-off of the pound sterling in the second half of April. As a result, the breakout of a low and a major sell-off has already pushed the trading instrument below the 26th level. Analysts believe that the British currency is likely to drop even more. The consumer price index is steadily moving towards double-digit indicators. Things are also quite tense because of supply chain disruptions against the background of a new wave of coronavirus in China. The situation will only worsen as inflation is projected to soar due to the geopolitical crisis. All analysts agree that consumer prices are sure to reach new highs in the coming months. The labor market situation, where employers are forced to fight for every employee by offering higher wages, is also fueling inflation. The pressure on the pound sterling also persists for another reason – the Fed's hawkish stance. At the May meeting, the FOMC may hike the interest rates by 0.75% at once. The US regulator may easily do so as the local economy is strong. The COT report for April 19 revealed that the number of long non-profit positions rose to 36,811from 35,514, while the number of short non-profit positions jumped to 95,727 from 88,568. It increased the negative delta of the non-commercial net position to -58 268 from -53 054. The weekly closing price declined to 1.2997 from 1.3022.

Signals of technical indicators
Moving averages
GBP/USD is trading near 30- and 50-period moving averages, which indicates the possibility of an upward reversal.
Remark. The author is analyzing the period and prices of moving averages on the 1-hour chart. So, it differs from the common definition of classic daily moving averages on the daily chart.
Bollinger Bands
In case of a rise, the upper border at about 1.2534 will act as resistance. In case of a decrease, the lower border at about 1.2414 will act as support.
Definitions of technical indicators
- Moving average recognizes an ongoing trend through leveling out volatility and market noise. A 50-period moving average is plotted yellow on the chart.
- Moving average identifies an ongoing trend through leveling out volatility and market noise. A 30-period moving average is displayed as the green line.
- MACD indicator represents a relationship between two moving averages that is a ratio of Moving Average Convergence/Divergence. The MACD is calculated by subtracting the 26-period Exponential Moving Average (EMA) from the 12-period EMA. A 9-day EMA of the MACD called the "signal line".
- Bollinger Bands is a momentum indicator. The upper and lower bands are typically 2 standard deviations +/- from a 20-day simple moving average.
- Non-commercial traders - speculators such as retail traders, hedge funds, and large institutions who use the futures market for speculative purposes and meet certain requirements.
- Non-commercial long positions represent the total long open position of non-commercial traders.
- Non-commercial short positions represent the total short open position of non-commercial traders.
- The overall non-commercial net position balance is the difference between short and long positions of non-commercial traders.
 English
 Русский
 Bahasa Indonesia
 Bahasa Malay
 ไทย
ไทย Español
 Deutsch
 Български
 Français
 Tiếng Việt
 中文
中文 বাংলা
বাংলা हिन्दी
 Čeština
 Українська
 Română

