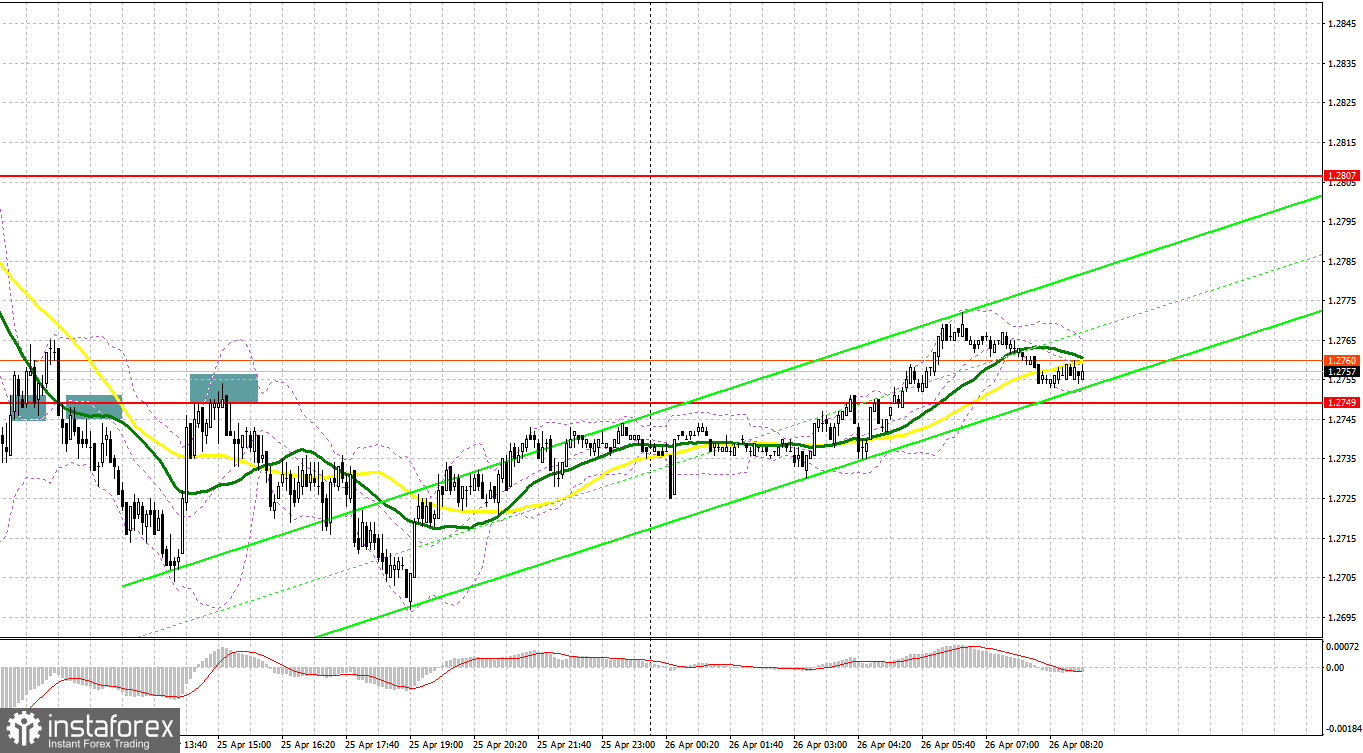
Yesterday, traders received only several signals to enter the market. Let us focus on the 5-minute chart to clear up the market situation. Earlier, I asked you to pay attention to the level of 1.2749. A break and a downward test of the level caused a buy signal. Traders had expected an upward correction after a massive sell-off during the Asian trade. However, the pair failed to show a rise. After several unsuccessful attempts, which gave only 20 pips of profit, pressure on the pound sterling returned.A break and an upward test of 1.2749 caused a sell signal, thus pushing the pair even lower. As a result, the pair dropped by about 45 pips. In addition, during the US trade, we saw the same false break of 1.2749, which led to a sell signal. As a result, the pair lost more than 50 pips.

Conditions for opening long positions on GBP/USD:
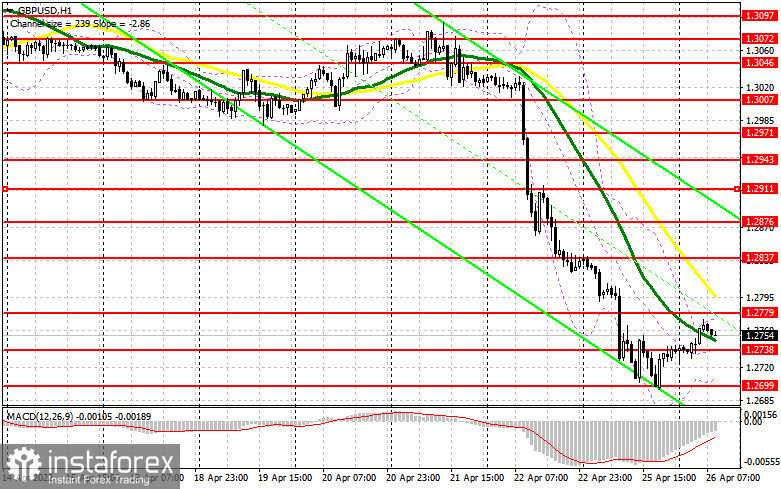
The pound sterling has no grounds to rise especially after the recent comments provided by Andrew Bailey. The Governor of the Bank of England said that the UK economy is on the edge of recession. The fact is that the Bank of England has not determined yet its future steps concerning monetary policy. However, the surging inflation requires higher interest rates. All these factors are exerting significant pressure on the British currency. What is more, higher interest rates may boost the price of borrowings, thus negatively affecting the whole economy. That is why traders should remain cautious when opening buy orders regardless of the current lows. The price may show a false break of the intermediate support level of 1.2738, which may act as the middle of the sideways channel. Only after that, traders may bet on the pair's recovery to 1.2779. A break and consolidation above this level as well as a test of this level and strong data on the public sector net borrowing may provide traders with a buy signal with the target at 1.2837, where it is recommended to lock in profits. In case of a decline and failure to protect 1.2738, it will be better to avoid buying the asset until the price hits the support level of 1.2699, this year's low. Notably, in this case, traders should also wait for a false break. In case of sluggish bullish activity, trades should consider long positions from 1.2645 or from a new month low of 1.2858, expecting a jump of 25-30 pips.
Conditions for opening short positions on GBP/USD:
Today, sellers should primarily break the support level of 1.2738 as this will allow them to regain full control over the market. A break and an upward test of this level will give a sell signal, which may push the pound/dollar pair to the low of 1.2699. There, the number of buyers is likely to drop. A break of the mentioned level may cause a decrease to the low of 1.2645, where it is recommended to lock in profits. A farther target is located at 1.2585. However, the pair will hardly hit this level at the beginning of the week. If itr advances, bears will do their best to protect the resistance level of 1.2779. A false break of this level will give a perfect sell signal, thus pointing to the continuation of the downtrend. If bears fail to be active at 1.2779, bulls will try to boost the pound sterling. In this case, traders should avoid sell orders until the price hits another important resistance level of 1.2837. There traders may consider short positions only after a false break. It is also possible to sell the pound/dollar pair from the high of 1.2876, expecting a drop of 30-35 pips.

COT report
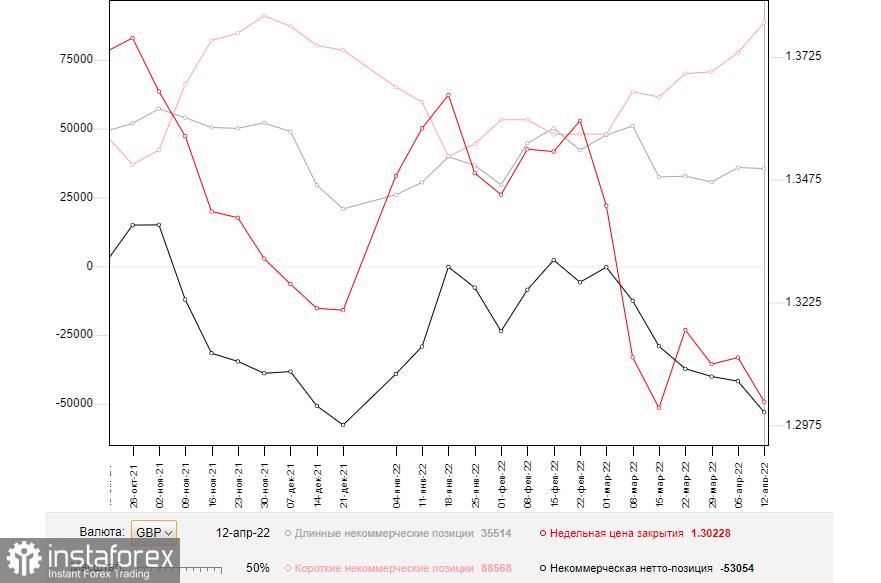
According to the COT report from April 12, the number of short positions increased, whereas the number of long positions declined. All this reflects traders' attitude towards the UK economy that is on the edge of recession and extremely inflation rate. In March, the consumer price index jumped to a new high of 7.0%, proving that the situation is really dramatic. In addition, the UK GDP report also added fuel to the problem. The situation is likely to become worse. It is very hard to predict future inflationary risks due to the existing geopolitical situation. However, it is obvious that the consumer price index will continue climbing in the next few months. Meanwhile, the dovish stance of the Bank of England will boost consumer prices. The Fed's hawkish approach to the situation in the US is expected to intensify pressure on the British pound. Notably, the UK has faced more difficult problems than the US. That is why the Federal Reserve may take more aggressive steps to combat surging inflation. Thus, in May, the US regulator may raise the benchmark rate once again, providing a new signal to sell the British pound. The COT report for April 12 unveiled that the number of long non-commercial positions decreased to 35,514 from 35,873, whereas the number of short non-commercial positions jumped to 88,568 from 77,631. This led to an increase in the negative value of the non-commercial net position to -53,054 from -41,758. The weekly closing price decreased from 1.3112 to 1.3022.

Signals of indicators:
Moving Averages
Trading is performed below 30- and 50-day moving averages, thus pointing to the recovery of the bearish trend.
Note: The period and prices of moving averages are considered by the author on the one-hour chart that differs from the general definition of the classic daily moving averages on the daily chart.
Bollinger Bands
In case of a rise, the upper limit of the indicator located at 1.2779 will act as resistance. If the pair drops, the support level will be located at 1.2699, the lower limit of the indicator.
Description of indicators
- Moving average (moving average, determines the current trend by smoothing volatility and noise). The period is 50. It is marked in yellow on the chart.
- Moving average (moving average, determines the current trend by smoothing volatility and noise). The period is 30. It is marked in green on the graph.
- MACD indicator (Moving Average Convergence/Divergence - convergence/divergence of moving averages). A fast EMA period is 12. A slow EMA period is 26. The SMA period is 9.
- Bollinger Bands. The period is 20.
- Non-profit speculative traders are individual traders, hedge funds, and large institutions that use the futures market for speculative purposes and meet certain requirements.
- Long non-commercial positions is a total number of long positions opened by non-commercial traders.
- Short non-commercial positions is a total number of short positions opened by non-commercial traders.
- The total non-commercial net position is a difference in the number of short and long positions opened by non-commercial traders.
 English
 Русский
 Bahasa Indonesia
 Bahasa Malay
 ไทย
ไทย Español
 Deutsch
 Български
 Français
 Tiếng Việt
 中文
中文 বাংলা
বাংলা हिन्दी
 Čeština
 Українська
 Română

