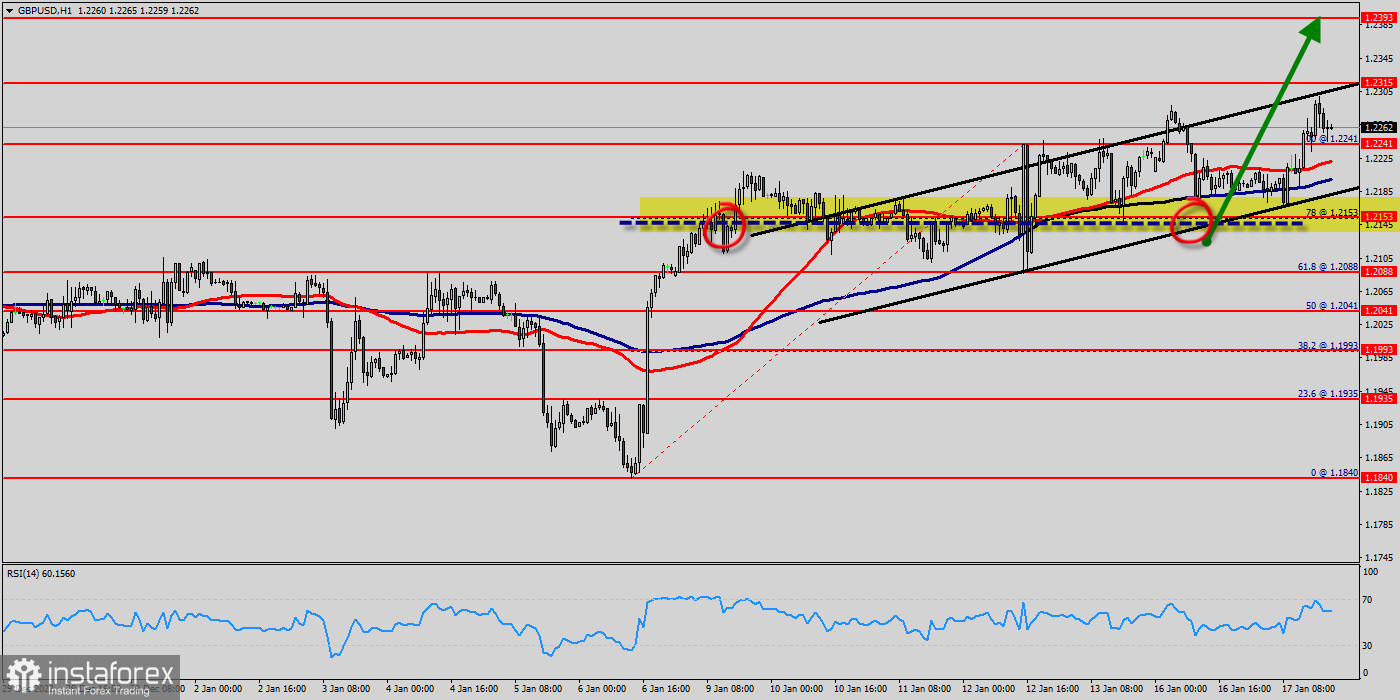
The bullish trend is currently very strong on the GBP/USD pair. As long as the price remains above the support levels of 1.2153 and 1.2088, you could try to benefit from the growth. The first bullish objective is located at the price of 1.2241. The bullish momentum would be boosted by a break in this resistance (1.2241). The hourly chart is currently still bullish. At the same time, some stabilization tendencies are visible between 1.2241 and 1.2315 in a few minutes. Together with the relatively large distance to the fast-rising 100-day moving average (1.2241), there are some arguments for a relief rally in coming months on the table. The GBP/USD pair is at highest against the dollar around the spot of 1.2241 and 1.2315 today - the GBP/USD pair is inside in upward channel. The GBP/USD pair decreased within an up channel, for that the GBP/USD pair its new highest 1.2353. Consequently, the first support is set at the level of 1.2241. Hence, the market is likely to show signs of a bullish trend around the area of 1.2241.
Our sentiment on the GBP/USD pair - GBP vs. US Dollar :
- Short term : Bullish market in short term.
- Tacit : Bullish market in long term.
Moreover, the double bottom is also coinciding with the major support this week. Additionally, the RSI is still calling for a strong bullish market as well as the current price is also above the moving average 100.
Therefore, it will be advantageous to buy above the support area of 1.2241. Commonly, traders use the RSI (Relative Strength Index) to define what? Areas that are potentially overbought or oversold. Overall, RSI readings below 30 indicate that the pair is oversold, while RSI readings over 70 indicate that it is overbought.
Buyers would then use the next resistance located at 1.2315 as an objective. Crossing it would then enable buyers to target 1.2305 (the double top - last bullish yesterday).
Be careful, given the powerful bullish rally underway, excesses could lead to a possible correction in the short term. If this is the case, remember that trading against the trend may be riskier. It would seem more appropriate to wait for a signal indicating reversal of the trend. The GBP/USD pair price could be awaiting a major upswing if the digital savings manages to slice above a fatal line of the first resistance that sets at the price of 1.2315 (Horizontal red line).
Re-buy orders are recommended above the major resistance rates of (1.2315) with the second target at the level of 1.2393.
Furthermore, if the trend is able to breakout through the second resistance level of 1.2393. We should see the pair climbing towards the next target of 1.2400 The pair will move upwards continuing the development of the bullish trend to the level 1.2425.
It might be noted that the level of 1.2425 is a good place to take profit because it will form a new double top in coming hours. The general bullish opinion of this analysis is in opposition with technical indicators.
As long as the invalidation level of this analysis is not breached, the bullish direction is still favored, however the current short-term correction should be carefully watched. The bulls must break through 1.2315 in order to resume the uptrend.
 English
 Русский
 Bahasa Indonesia
 Bahasa Malay
 ไทย
ไทย Español
 Deutsch
 Български
 Français
 Tiếng Việt
 中文
中文 বাংলা
বাংলা हिन्दी
 Čeština
 Українська
 Română

