 English
  Русский
 Bahasa Indonesia
 Bahasa Malay
 ไทย
ไทย Español
 Deutsch
 Български
 Français
 Tiếng Việt
 中文
中文 বাংলা
বাংলা हिन्दी
 Čeština
 Українська
 Română

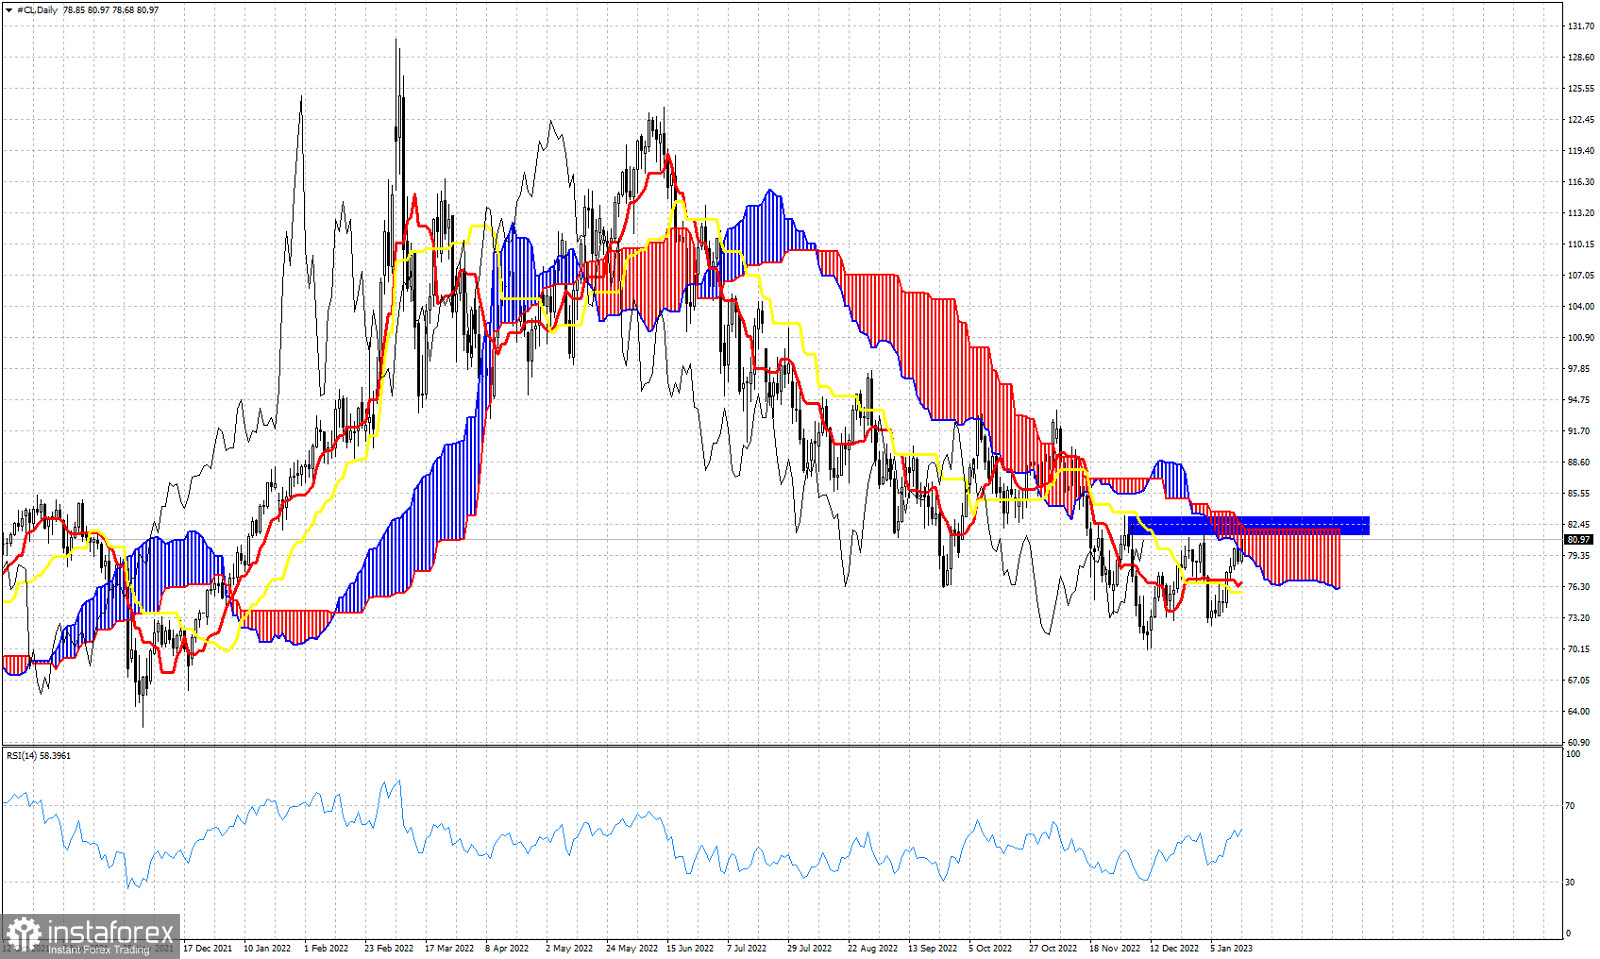
Blue rectangle- key horizontal resistance
Oil price is trading around $80-$81 and has just entered the Daily Kumo turning the trend from bearish to neutral. The decline from the June 2022 highs could very well be over. Bulls have a key resistance ahead to challenge at $82.50-$83. At $82.50 we find the upper cloud boundary and at $83 the horizontal resistance. A break above this resistance area would be a bullish reversal signal and Oil price could push higher towards $95-$100. Support is at $76 and as long as price is above this level, bulls have hopes for the start of a new upward sequence of higher highs and higher lows. Price is still below key resistance. Price remains vulnerable to the downside. The Ichimoku cloud indicator suggests that bulls will take control of the trend if they manage to recapture $83.