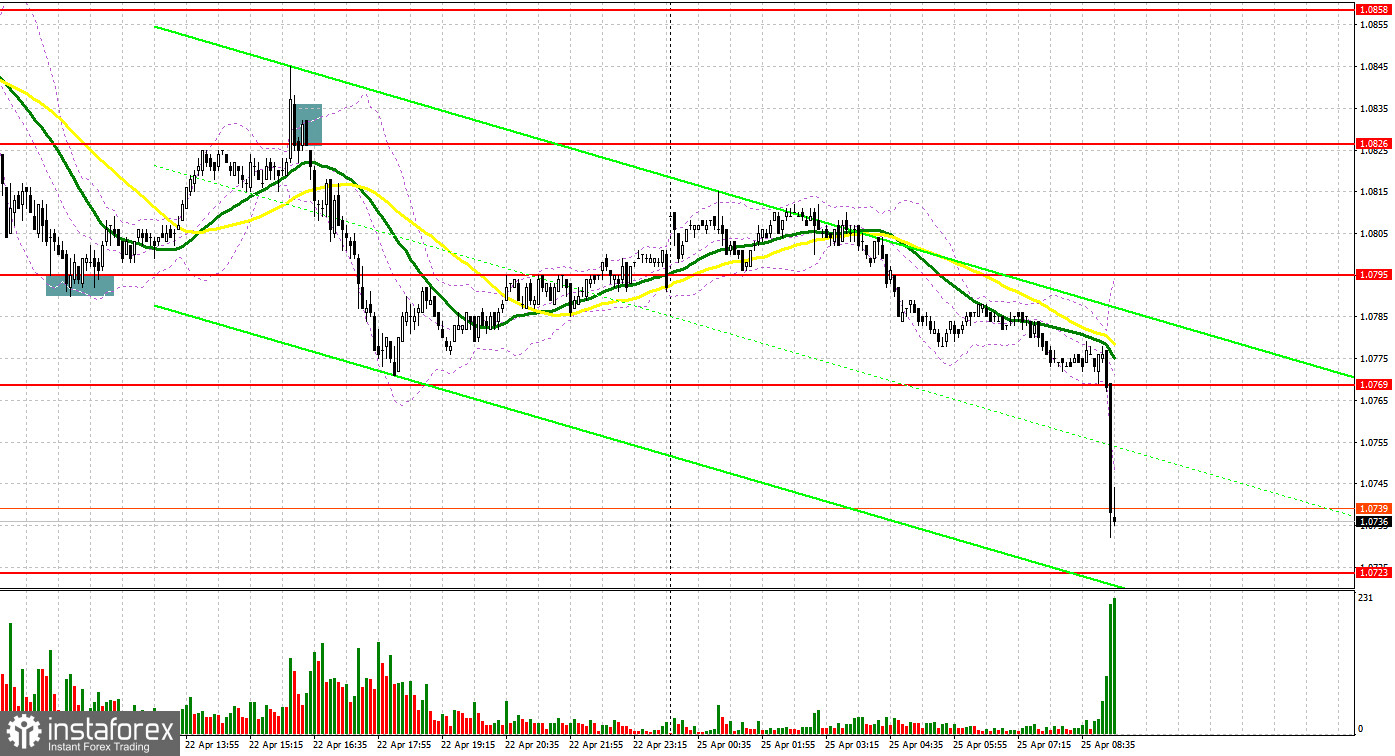
On Friday, there were several excellent entry points, which eventually brought a solid profit. Now let's look at the 5-minute chart and try to figure out what actually happened. In the morning article, I highlighted the levels of 1.0825 and 1.0795 and recommended taking decisions with these levels in focus. Despite quite positive PMI indexes for the eurozone, the euro kept declining in the first half of the day. The breakout of 1.0825 occurred without an upward test. For this reason, there was no good entry points to open short positions. As a result, the euro declined to the next support level of 1.0795. After that, EUR bulls returned to the market. A false breakout of this level generated a buy signal. The euro/dollar pair recovered to the resistance level of 1.0826. Having failed to rise higher, the bulls gave in and the bears were again back in control. After a false breakout and a sell signal, the pair slid down to a low of 1.0769.

What is needed to open long positions on EUR/USD
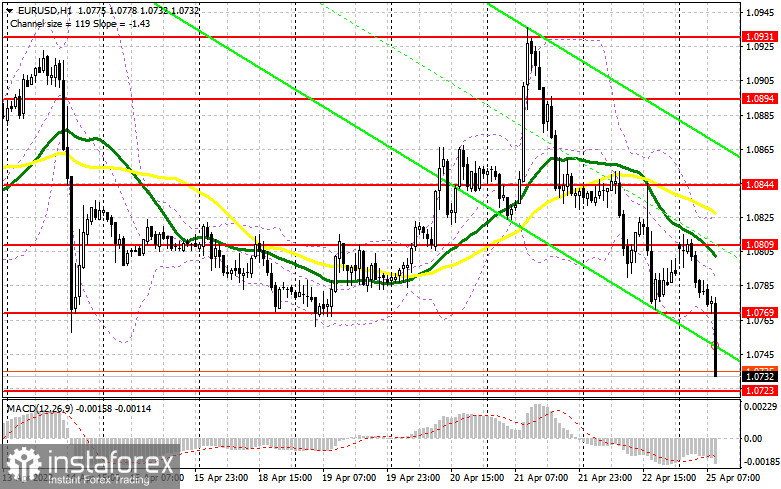
The euro was also unable to break out of the downward channel due to macroeconomic reports. They showed a slowdown in the EU economy amid soaring inflation. Today, Germany is scheduled to unveil the Ifo Business Climate indicator. The Ifo Business Climate Survey is a leading indicator of German economic activity, measuring the country's business environment. The figure is projected to be weak. If so, the pair may face another sell-off. The instrument has already been falling since the beginning of Asian trading. If this scenario comes true, it would be better to refrain from opening long positions. I would advise opening long positions if the pair slides down to 1.0723. However, only a false breakout of this level will give the first buy signal as the bulls are highly likely to assert strength. Earlier, they showed no activity at all, allowing the pair to decrease to the monthly lows. If this assumption is correct, the pair may rise to 1.0769. Yet, it will be quite hard for bulls to push the pair higher. Only a positive reaction to the Ifo data could trigger a breakout and a downward test of 1.0769, giving a new entry point into long positions. It will help the pair return to the 1.0809 level. Notably, the moving averages at this level are passing in the negative territory. This is why I recommend profit-taking at this level. If the pair declines in the European session and bulls show no activity at 1.0723, it is better to cancel long positions. This scenario looks possible, especially given the Fed's more aggressive approach to monetary policy and headwinds in the European economy. The optimal scenario for opening long oppositions will be a false breakout near the low of 1.0682. It is possible to open long positions on the euro immediately for a rebound only from 1.0636 or even a lower low around 1.0572, keeping in mind an upward intraday correction of 30-35 pips.
What is needed to open short positions on EUR/USD
Bears have already pushed the pair to monthly lows, resuming the bearish trend formed at the end of March. Further movement of the pair in the first half of the day will depend on the Ifo data and on the speech of ECB Executive Board member Fabio Panetta. If he voices concerns about the current state of the economy, the pressure on the euro will increase. As a result, there could be another sell-off. Of course, the optimal scenario for opening short positions will be a false breakout of 1.0769. It is likely to give the first sell signal as the pair could drop to 1.0723. This is a very important level. Thus, the bulls and bears are likely to tussle for the control of this level in the first half of the day. A breakout and consolidation below this level as well as an upward test may trigger a new sell-off of the euro. The price is sure to decrease to 1.0682 with a downward target of 1.0636. I recommend profit-taking at this level. A more distant target will be the 1.0572 level. Such a scenario is possible only after the negative reaction of traders to the Ifo report. If the euro rises in the first half of the day and bears show no energy at 1.0769, I expect a sharp jump of the euro. In this case, the optimal scenario for opening short positions will be a false breakout of 1.0809. You can sell EUR/USD immediately on a rebound from 1.0844 or even a higher high around 1.0894, keeping in mind a downward intraday correction of 25-30 pips.

COT report
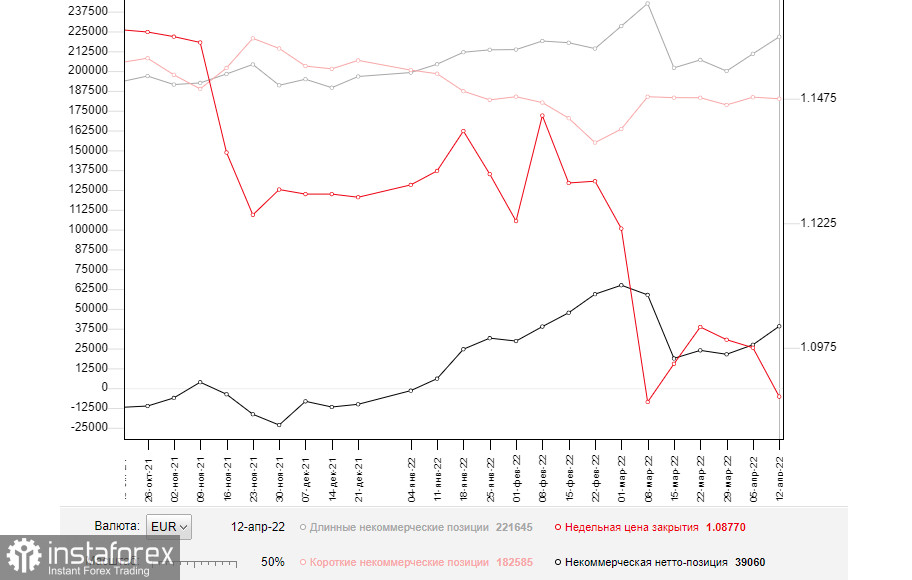
The COT report (Commitment of Traders) for April 12 logged a sharp increase in long positions and a small drop in short ones. The bullish sentiment is getting strong as market participants expect the ECB to take measures to cap inflation. Christine Lagarde signaled the likelihood of monetary policy tightening last week. The fact is that the ECB plans to fully complete the bond purchase program by the third quarter of this year. At the same time, the regulator is ready to start raising interest rates. Apparently, the ECB acknowledges the need to combat high inflation, which adversely affects household incomes. However, other countries are also coping with this issue. Last week, the US revealed its inflation data. As it turned out, the figure soared to a four-decade high. Galloping inflation forces the Fed to take a more aggressive stance on monetary policy. Analysts predict that the regulator could hike the interest rate by 0.5% at the May meeting. Demand for the US dollar remains high amid such expectations. The euro/dollar pair, on the contrary, is likely to drop lower. The euro is unable to regain ground amid Russia's active military actions in Ukraine and the lack of progress in negotiations between the two parties. The pressure on the pair is likely to persist in the near future. The COT report revealed that the number of long non-profit positions climbed to 221,645 from 210,914, while the number of short non-profit positions decreased to 182,585 from 183,544. Despite an increase in long positions, the COT report is of less importance to trades. The market situation changes rather quickly. Thus, the report does not reflect the real market situation. Besides, a decline in the euro makes it more attractive to speculators. Therefore, the accumulation of long positions is not surprising. At the end of the week, the total non-commercial net position rose to 39,060 against 27,370. The weekly closing price fell by almost 100 pips from 1.0976 to 1.0877.

Signals of technical indicators
Moving averages
EUR/USD is trading below 30- and 50-period moving averages. It means that the bears are in control again.
Remark. The author is analyzing a period and prices of moving averages on the 1-hour chart. So, it differs from the common definition of classic daily moving averages on the daily chart.
Bollinger Bands
In case of a rise, the upper border at about 1.0844 will act as resistance.
Definitions of technical indicators
- Moving average recognizes an ongoing trend through leveling out volatility and market noise. A 50-period moving average is plotted yellow on the chart.
- Moving average identifies an ongoing trend through leveling out volatility and market noise. A 30-period moving average is displayed as the green line.
- MACD indicator represents a relationship between two moving averages that is a ratio of Moving Average Convergence/Divergence. The MACD is calculated by subtracting the 26-period Exponential Moving Average (EMA) from the 12-period EMA. A 9-day EMA of the MACD called the "signal line".
- Bollinger Bands is a momentum indicator. The upper and lower bands are typically 2 standard deviations +/- from a 20-day simple moving average.
- Non-commercial traders - speculators such as retail traders, hedge funds and large institutions who use the futures market for speculative purposes and meet certain requirements.
- Non-commercial long positions represent the total long open position of non-commercial traders.
- Non-commercial short positions represent the total short open position of non-commercial traders.
- The overall non-commercial net position balance is the difference between short and long positions of non-commercial traders.
 English
 Русский
 Bahasa Indonesia
 Bahasa Malay
 ไทย
ไทย Español
 Deutsch
 Български
 Français
 Tiếng Việt
 中文
中文 বাংলা
বাংলা हिन्दी
 Čeština
 Українська
 Română

