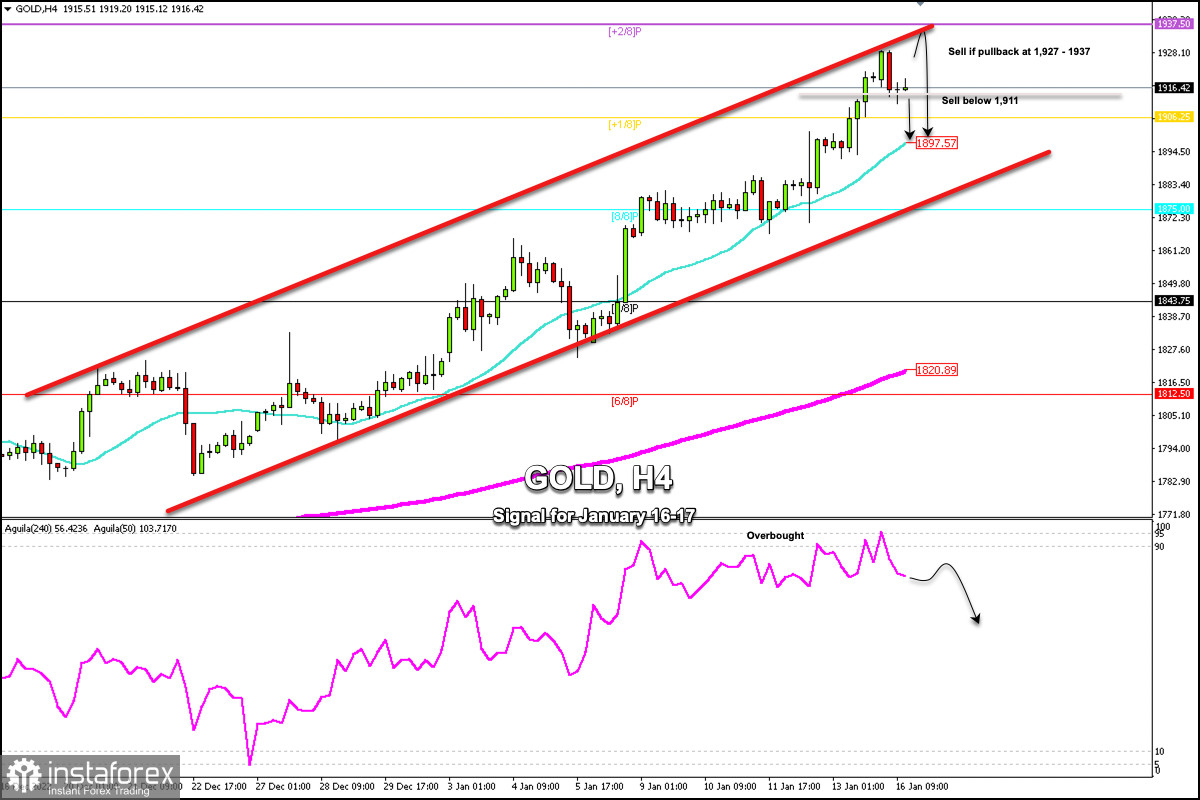
Early in the American session, Gold (XAU/USD) is trading around 1,916.42 with a bullish bias but is showing signs of exhaustion.
On the 4-hour chart, we can see the latest Japanese candlesticks, a bearish engulfing, and a Doji which would be a sign of a probable technical reversal. So, the price could reach the 21 SMA around 1,897.
The daily pivot point is located around 1,911. A daily close below this level could mean the start of a strong technical correction that could bring the price down to support levels of 1,875 (8/8 Murray).
Gold is showing signs of overbought. We can see on the 4-hour chart that since January 5, the metal has been oscillating around 90-95 points of reference of the eagle indicator. This week, a strong technical correction is likely to occur in case the price reaches 1,930 and 1,937 and settles below these levels.
The zone of 1,937.50 represented by + 2/8 Murray means a strong technical correction. It is likely that any technical bounce that approaches this zone will be seen as a signal to sell.
With a daily close below the psychological level of 1,900, we could expect the metal to continue lower and reach 1,875. The price could even fall to support of 7/8 Murray at 1,843.
Our trading plan for the next few hours is to sell below 1,911 or wait for a pullback to 1,928 and 1,937 to sell with targets at 1,906 and 1,890.
 English
 Русский
 Bahasa Indonesia
 Bahasa Malay
 ไทย
ไทย Español
 Deutsch
 Български
 Français
 Tiếng Việt
 中文
中文 বাংলা
বাংলা हिन्दी
 Čeština
 Українська
 Română

