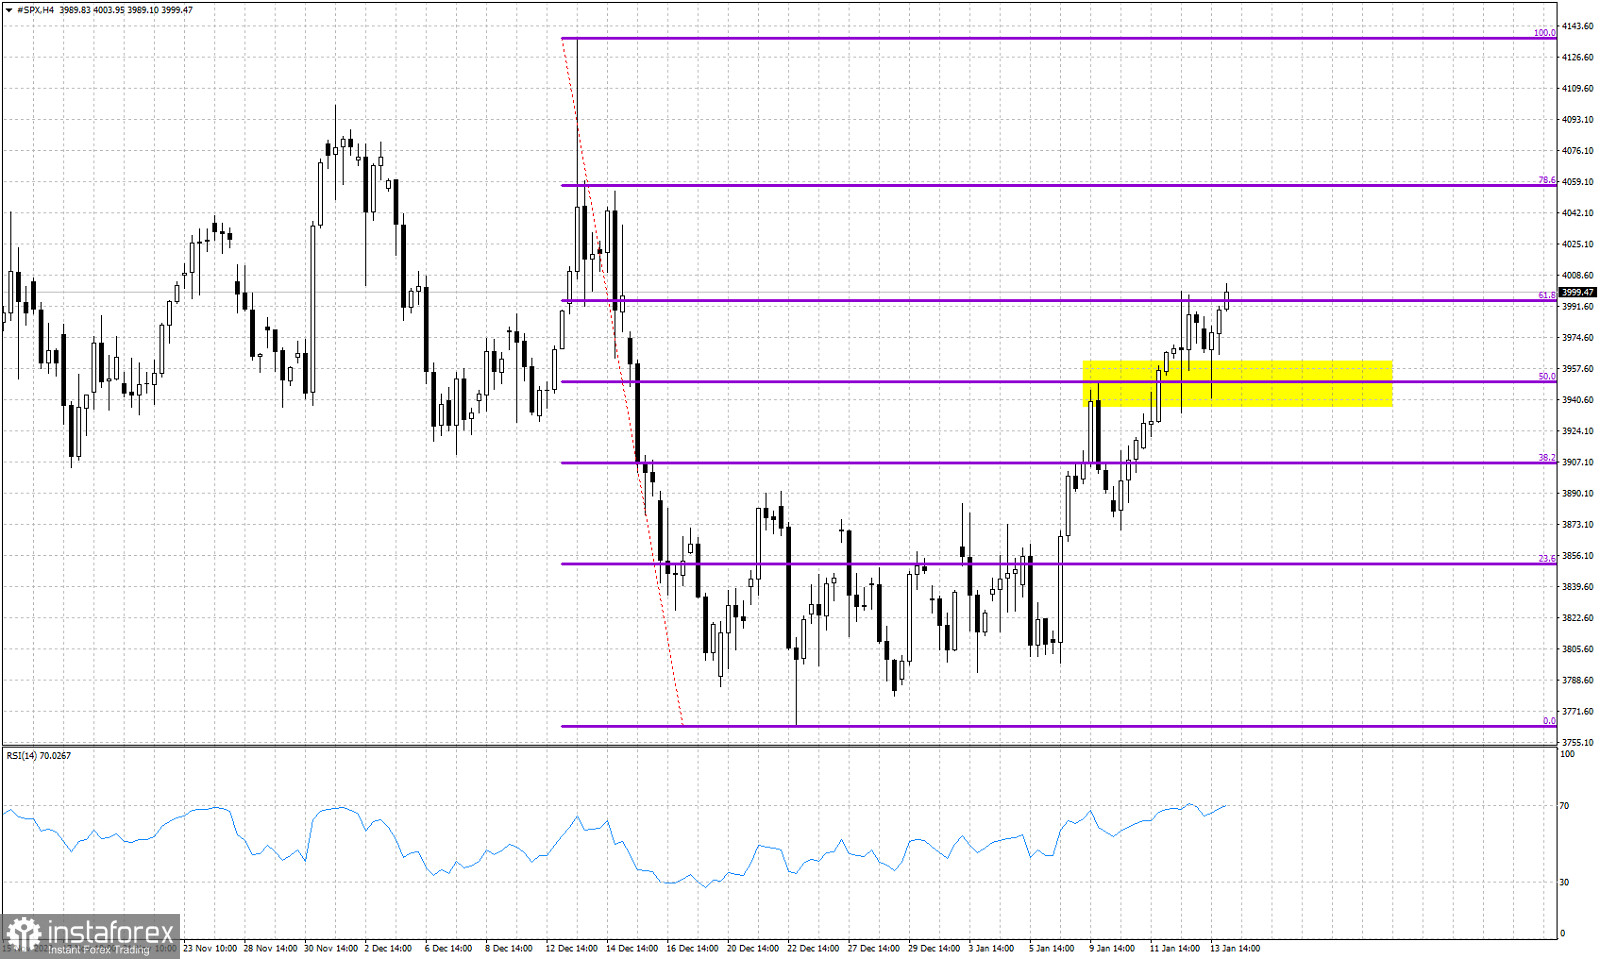
Violet lines- Fibonacci retracement levels
yellow rectangle- support
SPX remains in a short-term up trend making higher highs and higher lows. Price has now retraced 61.8% of the decline from 4,136 top at December 13th. The 61.8% Fibonacci retracement is key short-term resistance level. Price recently made two pull backs towards 3,940 and both times price was respected and trend supported. This is now key short-term support. Bulls do not want to see price break below this level. On the other hand, short-term upside target is the next Fibonacci retracement level at 4,050-60. At the 61.8% retracement level we usually see trend reversals. In this case if we see a rejection and a break below 3,940 we will see that trend has reversed to bearish. Until then bulls remain in control.
 English
 Русский
 Bahasa Indonesia
 Bahasa Malay
 ไทย
ไทย Español
 Deutsch
 Български
 Français
 Tiếng Việt
 中文
中文 বাংলা
বাংলা हिन्दी
 Čeština
 Українська
 Română

