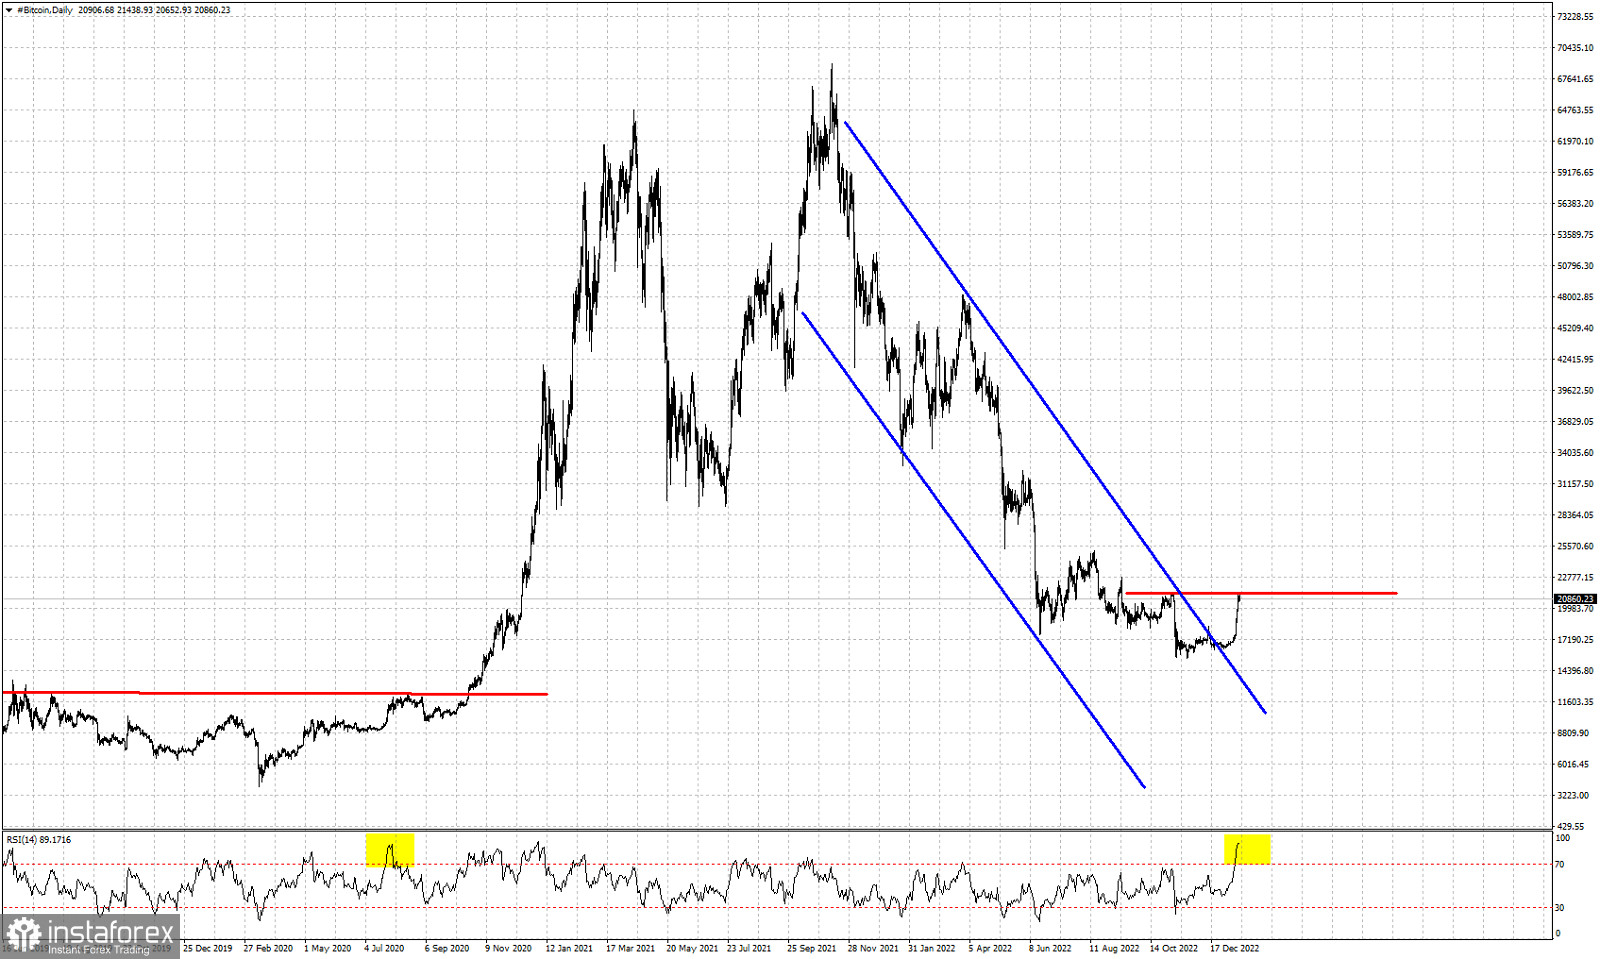
Blue lines- bearish channel
Red lines- horizontal resistance levels
Yellow lines- overbought RSI
Bitcoin is trading around $20,000-$21,000 price level after the break out and above the short-term trading range it was in for the last few months. Our minimum bounce target after the break out, was the November high around $21,400 pre FTX scandal sell off. Price is now challenging this horizontal resistance level. Price has already broken out of the bearish channel it was in for the last 13 months. Similar to 2019-2020 price is challenging key horizontal resistance and the RSI has reached oversold levels near 90. A pull back and a new higher high would be a very bullish signal. Our minimum expectations are for price to retrace the entire decline. After a break above the resistance at $21,400, we should expect Bitcoin to reach $27,800 where we find the 23.6% Fibonacci retracement of the entire decline. The 38% retracement is at $35,800 and should follow if bulls break above $27,800.
 English
 Русский
 Bahasa Indonesia
 Bahasa Malay
 ไทย
ไทย Español
 Deutsch
 Български
 Français
 Tiếng Việt
 中文
中文 বাংলা
বাংলা हिन्दी
 Čeština
 Українська
 Română

