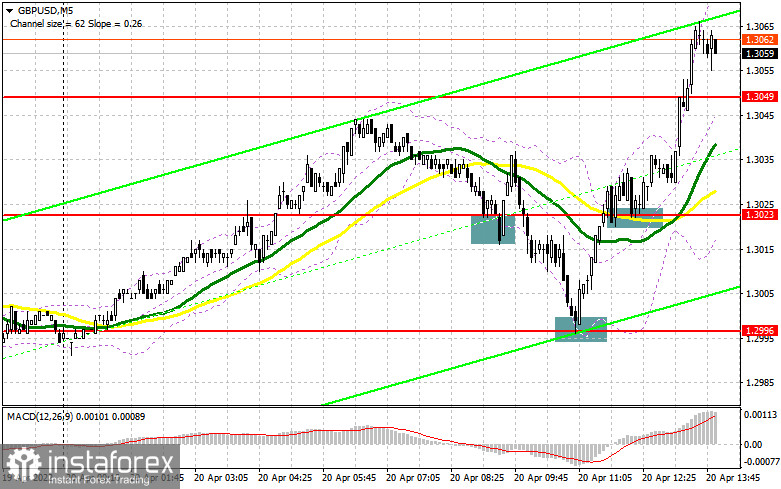
In my forecast this morning, I drew your attention to the levels 1.3023 and 1.2996 and recommended entering the market from them. Let's have a look at the 5-minute chart and analyze what happened. A false breakout at 1.3023 at the beginning of the European session gave a buy signal for the pound, but the strong rally did not occur. As a result, the pound collapsed, which led to the fixation of the losses. The problems did not end there as a false breakout at 1.2996 created another buy signal for the pound, and after a while, bulls managed to break back above 1.3023, which allowed sending the pair up by about 30 points and taking profits. The top/bottom test of 1.3023 confirmed one more entry point, which made more than 40 pips profit and judging by the current market situation, it was not the limit.

Long positions on GBP/USD:
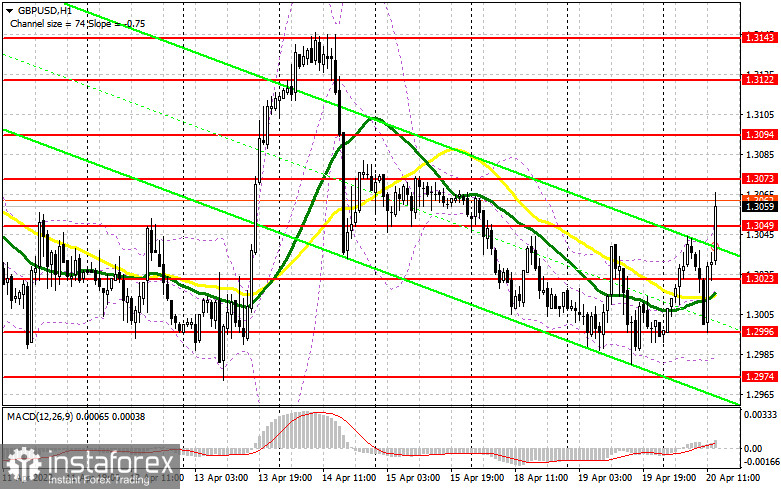
In the second half of the day, the technical picture did not change in any way, but the trading plan had to be revised. Taking into account the fact that there are no important fundamental statistics on the US economy, and there are only speeches of the Fed representatives, I suggest we focus on them. Mary Daly and Charles Evans are likely to bring up the topic of interest rates, counting on curbing high inflation, which is accelerating at a quick pace to the area of 9.0%. This is likely to create a signal to sell the pound, but I am sure that bulls will try to do their best not to miss the support at 1.3049. Only after the false breakout with the weak data on the secondary housing market sales in the US can we hope for the pair to go up again to the area of 1.3073 and for the pair to break out of the range. To change a picture, bulls need something to fall back on. Taking into consideration that there are not many positive factors in the market so far, it will not be easy for the pair to go above the resistance of 1.3073. Only a breakout and the top/bottom test of this level may form an additional entry point into long positions, which will strengthen bulls' positions and open the way to the area of 1.3094. The next target is located at 1.3122, where traders may take profits. If the pound declines and bulls show weak activity at 1.3049, which is likely to happen, the pressure on the pair will return very quickly. In this case, it is better to postpone opening longs until the pair reaches the morning support at 1.3023. It is also better to enter the market from this level only after a false breakout. You can buy the GBP/USD pair on the rebound from the low at 1.2996, or even lower near 1.29574, allowing an intraday correction of 30-35 pips.
Short positions on GBP/USD:
Bears managed to send the pair back to the downside after it gained during the Asian session, but immediately faced an active opposition from bulls. They drove the pound to new weekly highs, counting on the continuation of the bullish correction. Bears will focus on US statistics which will help bring the pair below 1.3049 again, but the foremost concern is to hold the price below the new resistance at 1.3073. A false breakout at this level will be an excellent sell signal. If this happens, a breakthrough of 1.3049 can also occur. A breakout and a reverse test bottom/top of this level may create an additional sell signal, which may return the pound to 1.3023, where the moving averages are passing, and then to the area of 1.2996, where traders may lock in profits. If the GBP/USD pair grows and bears show a lack of activity at 1.3073, I suggest postponing short positions until the pair reaches resistance at 1.3094. I also recommend opening short positions from this level only if a false breakout is formed. You can also sell the pound on the rebound from the high of 1.3122, allowing an intraday rebound to the downside by 30-35 pips.

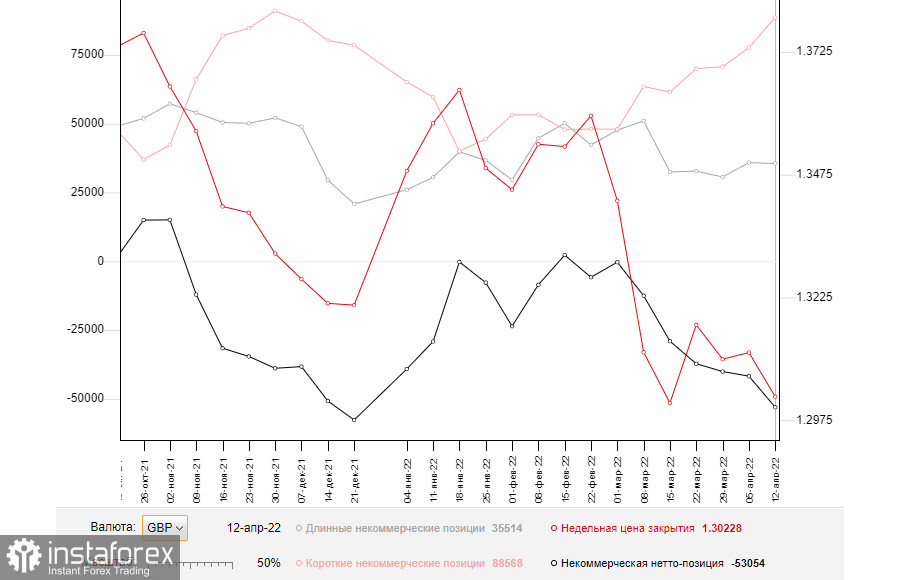
The COT (Commitment of Traders) report for April 12 logged an increase in short positions and a reduction in the long ones. This once again confirmed the attitude of traders to the UK economy, which is on the brink of recession mixed with the highest inflation last seen a long time ago. The sharp increase in the consumer price index in March to the high of 7.0% proved the complexity of the situation in which the Bank of England found itself, but the report on the UK GDP, on the contrary, did not bring traders any excitement. The situation is likely to worsen, as future inflation risks are quite difficult to assess now because of the difficult geopolitical situation. However, the consumer price index will continue to grow in the coming months. At the same time, the dovish stance of the Governor of the Bank of England may push prices up. Pressure on the pound is also increasing because of the aggressive policy of the Fed, which is becoming more hawkish by the day. The US does not have the same economic problems as the UK, so the Fed can raise rates more aggressively, which it is going to do at the May meeting. This gives us another signal to sell the pound against the US dollar. The April 12 COT report showed that long non-commercials declined to 35,514 from 35,873, while short non-commercials jumped to 88,568 from 77,631. This led to an increase in the negative non-commercial net position to -53,054 from -41,758. The weekly closing price dropped to 1.3022 from 1.3112.

Indicators' signals:
Moving averages
The pair is trading above the 30- and 50-day moving averages, indicating the bulls' attempt to continue the correction.
Note: The period and prices of the moving averages are considered by the author on the hourly chart H1 and differ from the general definition of the classic daily moving averages on the daily chart D1.
Bollinger Bands
If the pair declines, the lower boundary of the indicator near 1.2980 will act as support.
Indicators' description
- Moving average defines the current trend by smoothing out volatility and noise. Period 50. Marked in yellow.
- Moving average defines the current trend by smoothing out volatility and noise. Period 30. Marked in green.
- MACD (Moving Average Convergence/Divergence) indicator Fast EMA of period 12. Slow EMA period 26. SMA period 9
- Bollinger Bands. Period 20
- Non-commercial traders are speculators, such as individual traders, hedge funds, and large institutions, which use the futures market for speculative purposes and meet certain requirements.
- Long non-commercial positions represent the total long open position of non-commercial traders.
- Short non-commercial positions represent the total short open position of non-commercial traders.
- Total non-commercial net position is the difference between short and long positions of non-commercial traders.
 English
 Русский
 Bahasa Indonesia
 Bahasa Malay
 ไทย
ไทย Español
 Deutsch
 Български
 Français
 Tiếng Việt
 中文
中文 বাংলা
বাংলা हिन्दी
 Čeština
 Українська
 Română

