GBP/USD
Analysis:
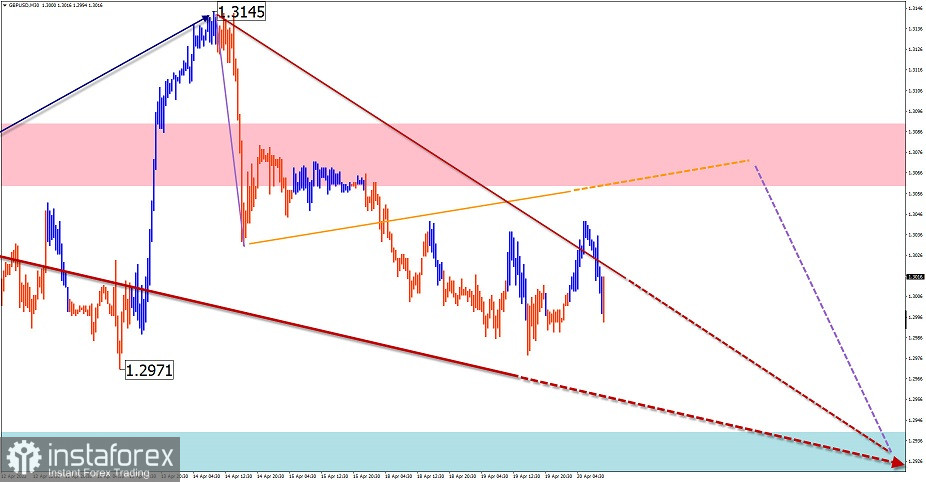
GBP/USD continues the downtrend. The unfinished wave section dates back to March 23. A week ago, the final part (C) started to form. In recent days, an intermediate pullback has been formed within this wave section.
Forecast:
Today, the pair is expected to move sideways. In the first half of the day, the price is likely to move upwards toward the estimated resistance level. At the end of the day or tomorrow, the price may resume the downtrend.
Potential reversal zones
Resistance:
- 1.3060/1.3090
Support:
- 1.2940/1.2910
Recommendations:
In the coming sessions, trading in the GBP/USD market will be possible only with a scalping technique. Selling from the resistance zone seems a better option. It is advisable to refrain from entering the market until the current uptrend is finished.

AUD/USD
Analysis:
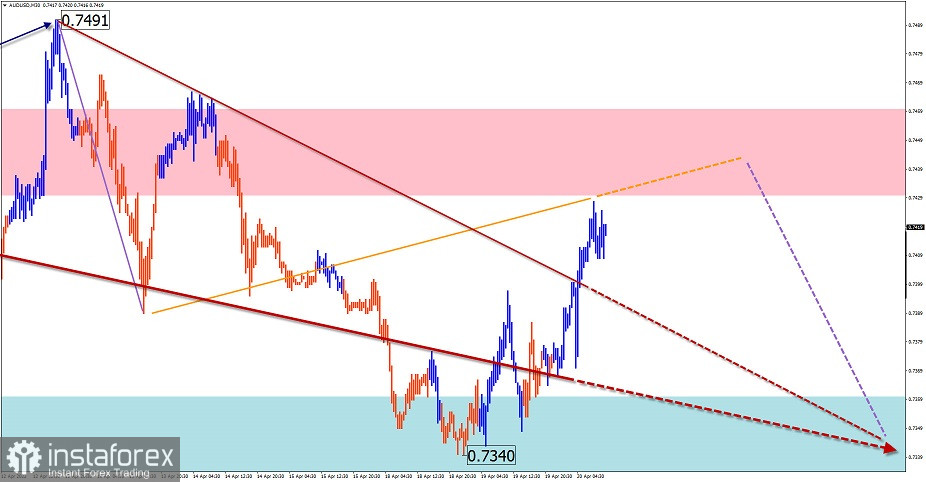
In the course of the uptrend, the AUD/USD pair ended up in a strong potential reversal zone. Since April 5, the price has been forming an opposite correction that corresponds with the entire previous wave. The ascending section from April 18 goes well with the trajectory of the emerging pullback and looks like a sideways channel. At the time of writing, the price is approaching the lower boundary of the intermediate resistance on the daily time frame.
Forecast:
Today, AUD/USD is expected to complete the uptrend, forming a reversal near the resistance zone and resuming the downward movement.
Potential reversal zones
Resistance:
- 0.7430/0.7460
Support:
- 0.7360/0.7330
Recommendations:
At the moment, there are no conditions for going long on AUD/USD. It is recommended to sell the pair only after getting confirmed signals of a reversal near the resistance zone.

USD/CHF
Analysis:
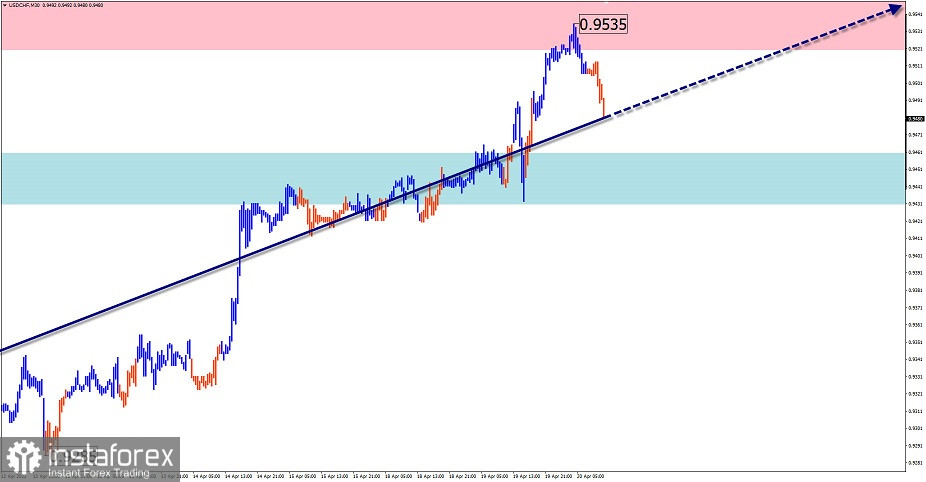
The fluctuations of the past months have changed the current wave layout. A rise from January 14 is part of a separate wave structure which, in turn, completes a larger wave initiated in May 2021. At the moment of writing, the quotes have reached the lower line of a strong resistance area. There are no reversal signals on the chart.
Forecast:
In the next 24 hours, the price is expected to fluctuate between the two opposite zones. During the day, a downward movement is more likely. Later on, the pair may resume growth and make another attempt to test resistance.
Potential reversal zones
Resistance:
- 0.9520/0.9550
Support:
- 0.9460/0.9430
Recommendations:
Selling USD/CHF is risky today and can lead to losses. It is recommended to refrain from entering the market until the decline is completed. You can buy the pair after getting a reversal signal near the support area.

USD/CAD
Analysis:
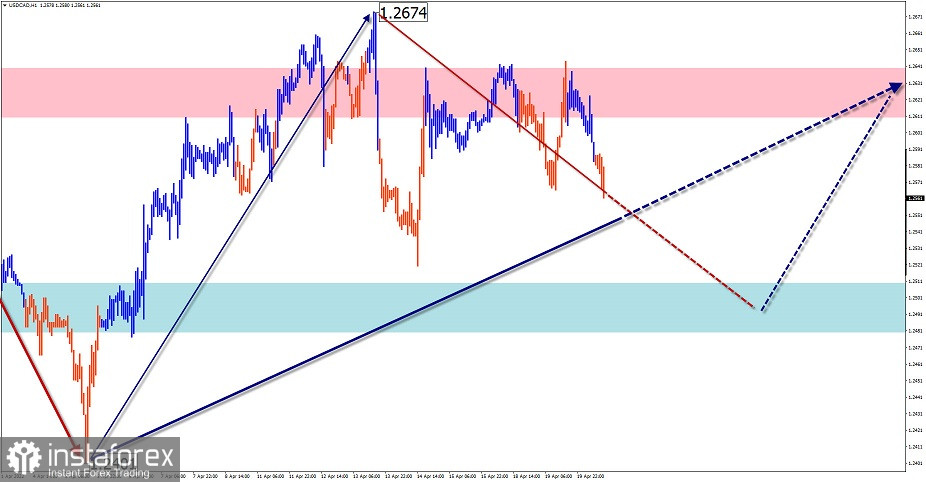
The incomplete wave structure on the USD/CAD chart is pointing upwards. A correction has been forming within this wave since last summer. The current descending wave was formed on March 8. Within its structure, a corrective wave section (B) has been developing for the past month.
Forecast:
In the coming sessions, the USD/CAD pair is expected to stay in a flat channel. In the first half of the day, the quote may decline to the support levels. Later in the day or tomorrow, the pair is likely to resume growth.
Potential reversal zones
Resistance:
- 1.2610/1.2640
Support:
- 1.2510/1.2480
Recommendations:
During the day, it is possible to open sell positions for the short term with a fractional lot. The upcoming decline may have a short-lived nature. It is better to wait until a confirmed buy signal appears near the support area.

Explanation: In simplified wave analysis (SWA), waves consist of 3 parts (A-B-C). We analyze the last unfinished wave. The solid arrow background shows the structure that has been formed. The dashed lines show the expected movements.
Note: The wave algorithm does not take into account the duration of the instrument's movements over time!
 English
 Русский
 Bahasa Indonesia
 Bahasa Malay
 ไทย
ไทย Español
 Deutsch
 Български
 Français
 Tiếng Việt
 中文
中文 বাংলা
বাংলা हिन्दी
 Čeština
 Українська
 Română

