EUR/USD

Higher time frames
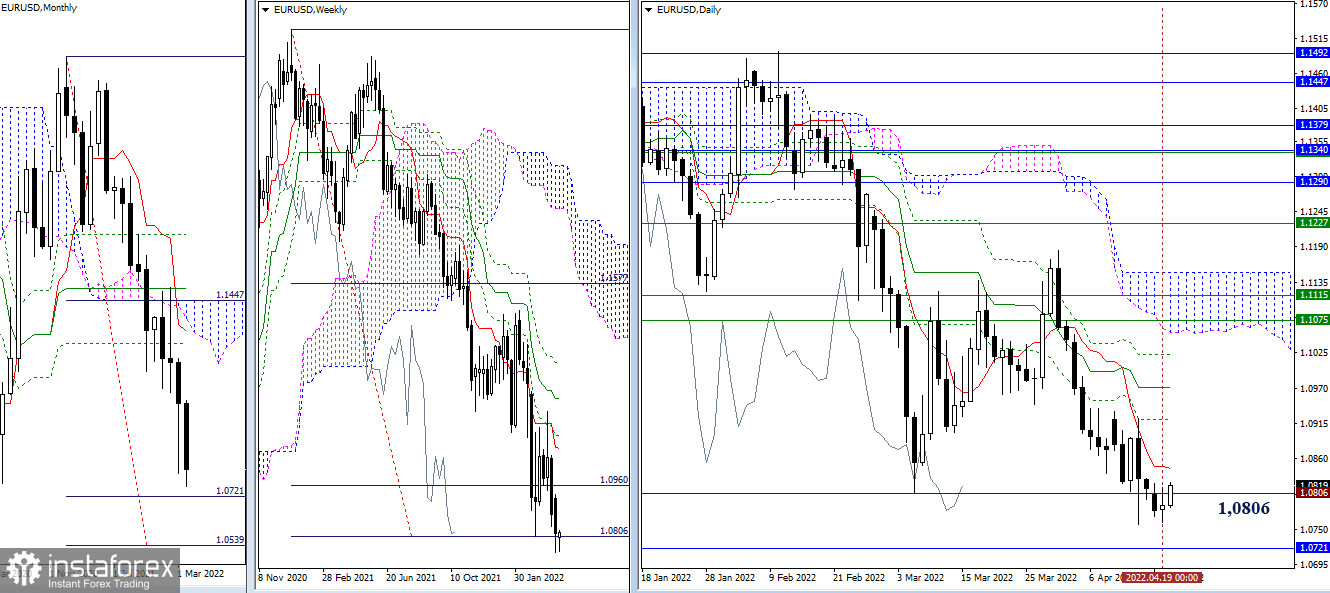
Yesterday, the pair failed to break through the weekly low of 1.0758, and a small bullish candlestick was formed by the close of the day. We may well expect the quote to retrace up. Importantly, the price is still under the influence of the 100% retracement level of 1.0806. In case of consolidation above the mark, the pair will ascend and test the area of 1.0846/1.0921/1.0972/1.1022 resistance levels of the daily death cross of the Ichimoku indicator. In the event of a fall, targets are seen at the support levels of 1.0721 and 1.0539.

H4 – H1
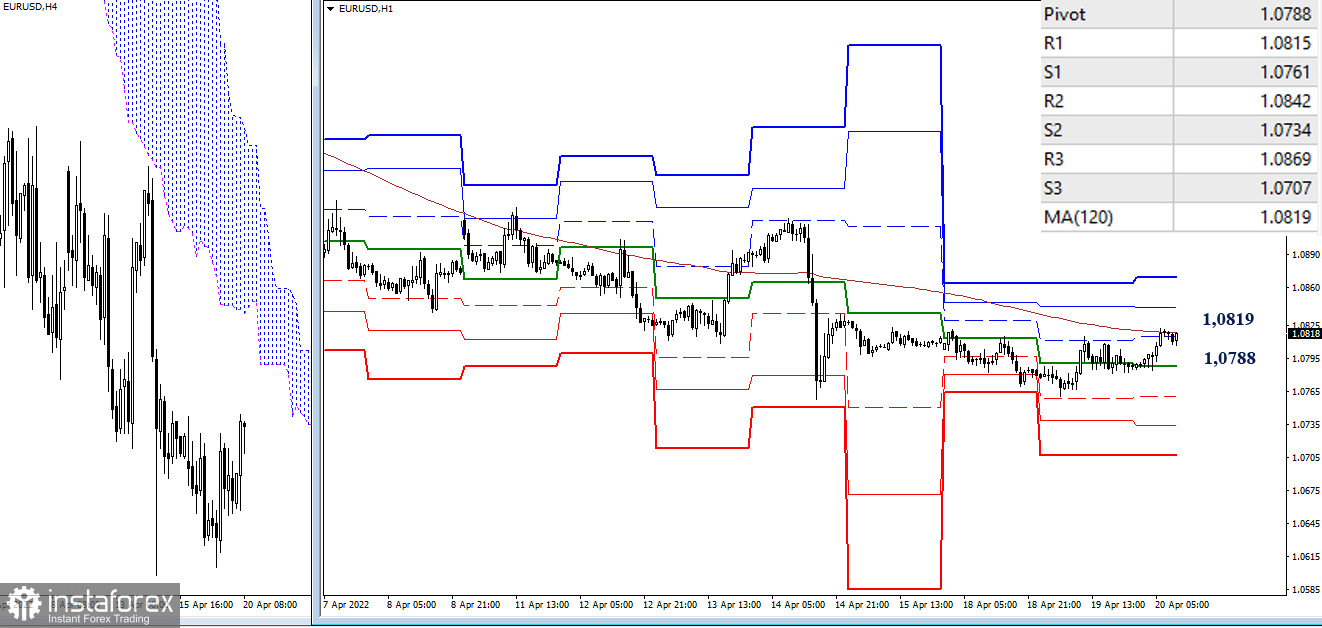
In lower time frames, bulls and bears are trying to establish control over the key levels of 1.0788 (central Pivot level) and 1.0819 (weekly long-term trend). Bullish sentiment will grow if the quote consolidates above those levels. Additional reference points stand at 1.0842 (R2) and 1.0869 (R3). The downtrend will resume if the price leaves the corrective zone and updates the 1.0758 low. Intraday bearish targets are seen at classical Pivot support levels of 1.0761/1.0734/1.0707.
***
GBP/USD

Higher time frames
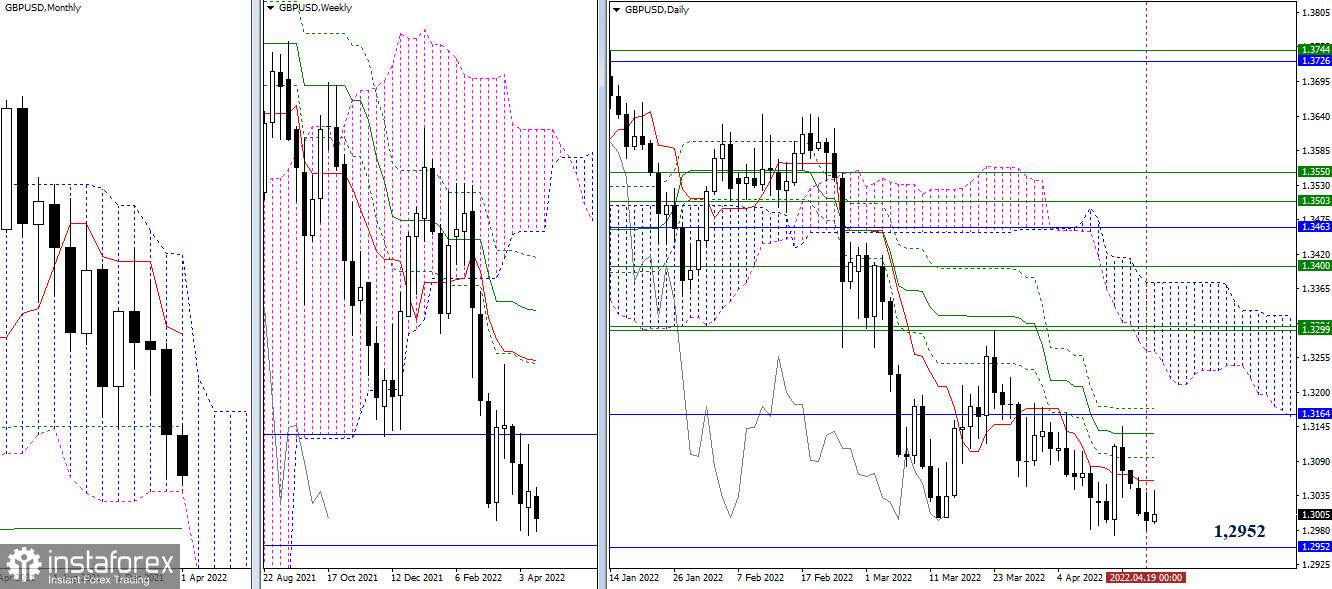
The nearest support is still seen at 1.2952, the lower limit of the monthly Ichimoku Cloud. Meanwhile, 1.2830 (monthly medium-term trend) serves as the next support level. The resistance zone is marked by levels 1.3059/1.3097/1.3135/1.3173 (daily Ichimoku cross) and gains from the monthly level around 1.3164.

H4 – H1
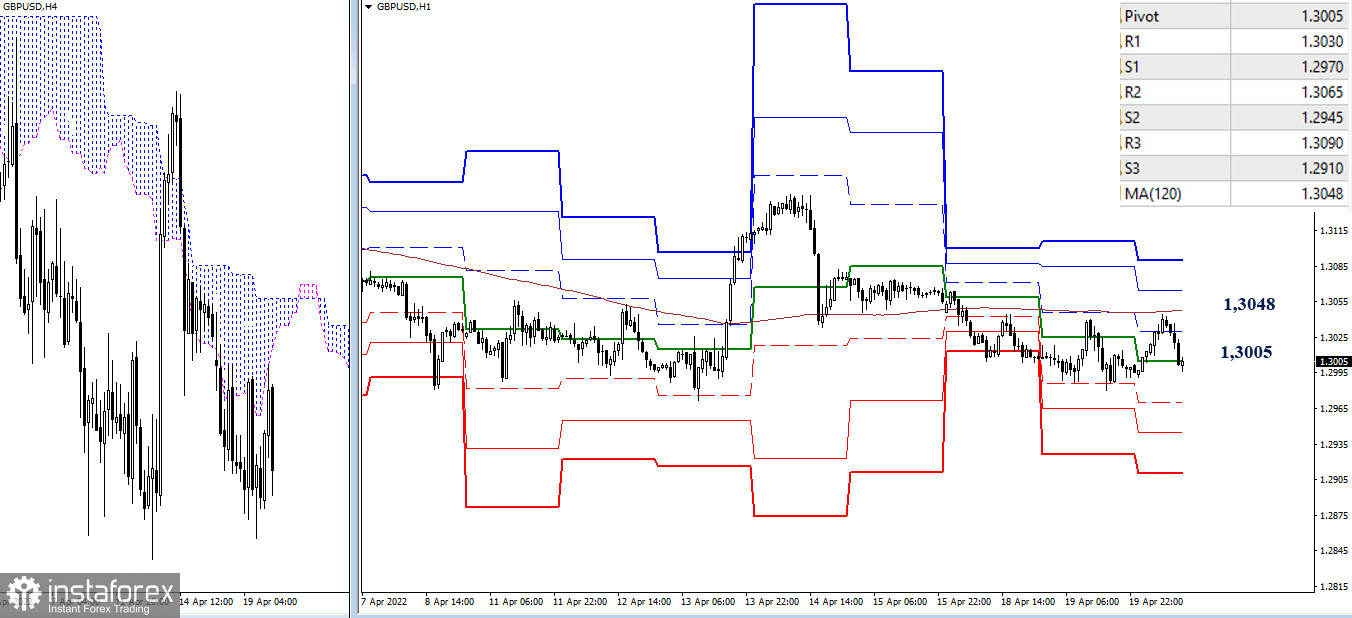
In lower time frames, the quote still trades in the range between 1.3005 (central Pivot level) and 1.3048 (weekly long-term trend). Downward intraday targets are seen at 1.2970/1.2945/1.2910 (classical Pivot resistance levels). If the quote settles above the key levels of 1.3005 and 1.3048 and the moving average reverses, the uptrend may resume with targets at 1.3065 and 1.3090 (classical Pivot resistance levels).
***
Technical indicators used:
Higher time frames – Ichimoku Kinko Hyo (9.26.52) + Fibo Kijun levels
H1 – Pivot Points (classical) + Moving Average 120 (weekly long-term trend)
 English
 Русский
 Bahasa Indonesia
 Bahasa Malay
 ไทย
ไทย Español
 Deutsch
 Български
 Français
 Tiếng Việt
 中文
中文 বাংলা
বাংলা हिन्दी
 Čeština
 Українська
 Română

