Technical outlook:
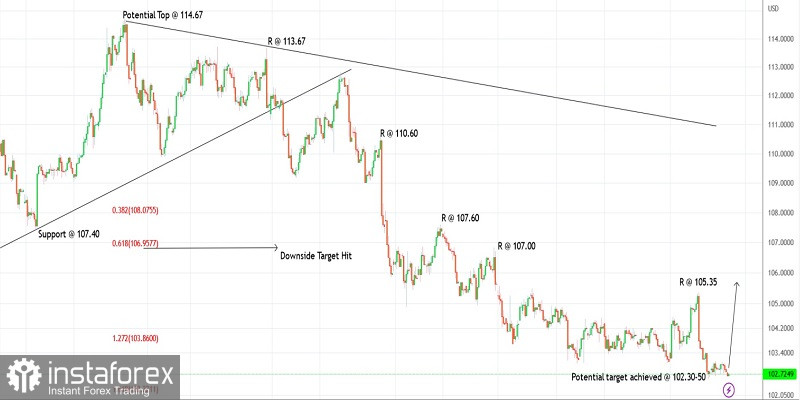
The US dollar index slipped through the 102.63 lows during the Asian session on Friday, testing the previous swing low at 102.57. The fact that the bulls are still holding the above price support is indicative of a potential sharp bullish reversal from here in the near term. The index is seen to be trading close to 102.80 at this point in writing as the bulls remain poised for a comeback.
The US dollar index might have terminated its larger-degree drop, which started from 114.70 in September 2022. Prices carved a low around 102.55, close to the projected Fibonacci 1.618 extension at 102.30 as seen on the 4H chart presented here. If the above structure holds true, we can expect a sharp rally at least towards 110.00 in the next few trading sessions.
The US dollar index is facing immediate resistance at 105.35, while support comes in just around the 102.00-30 zone. The fact that RSI is also showing bullish divergence on several timeframes (not shown today) also builds a strong case of a potential bullish turn from current levels. Only a significant and consistent break below 102.30 will nullify the bullish scenario.
Trading idea:
Potential rally against 101.50
Good luck!
 English
 Русский
 Bahasa Indonesia
 Bahasa Malay
 ไทย
ไทย Español
 Deutsch
 Български
 Français
 Tiếng Việt
 中文
中文 বাংলা
বাংলা हिन्दी
 Čeština
 Українська
 Română

