GBP/USD 5M

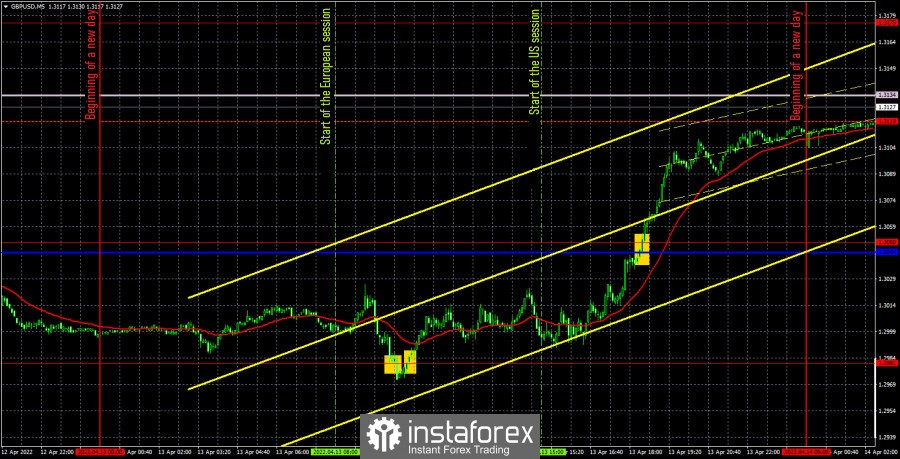
The GBP/USD currency pair was trading exclusively sideways and in a narrow price range on Wednesday morning. However, everything changed in the US trading session, and the pound began to grow unexpectedly for many. We have already said that there was, rather, a fall in the US currency, rather than a rise in the pound, since the European currency also showed growth. And the fall of the dollar could occur due to the report on crude oil reserves, which turned out to be nine times more than predicted. Of course, hardly anyone could have predicted such a value of the report, hardly anyone could have predicted that once a year the market would react to it. Nevertheless, there was also a technical signal for the pair's growth. The price could not overcome the level of 1.2981 yesterday, which is the low for 15 months. Thus, a rebound from this level could also well provoke a strong rebound. However, if we take a medium-term perspective, we do not see that the balance of power between the euro, the pound and the dollar has changed dramatically. Thus, despite the growth of the pound on Wednesday, the fall of the pair still remains the most likely development of events.
As for trading signals, there was, by and large, only one. In the European trading session, the price bounced from the level of 1.2981, but it did it very inaccurately, and traders could initially open a short position, since the withdrawal below this level was quite deep. But it doesn't matter. In this case, the short position closed at a small loss, after which a buy signal was formed, which also had to be worked out. After its formation, the pair went up 110 points and that's how much you could earn on the second deal. Naturally, the loss on the first transaction was completely covered.
COT report:

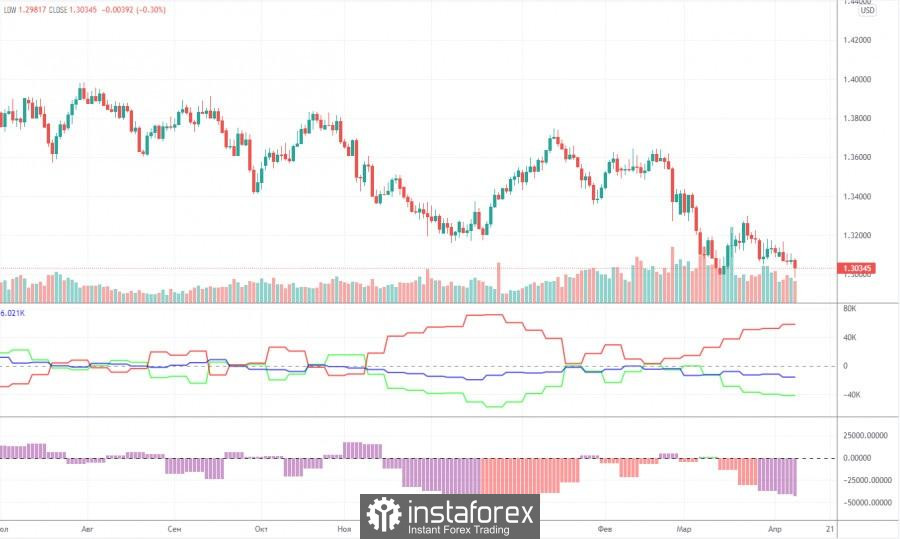
The latest Commitment of Traders (COT) report on the British pound showed minimal changes in the mood of major players. For a whole week, the non-commercial group opened 5,200 long positions and 6,900 short positions. Thus, the net position of non-commercial traders decreased by 1,700. Even for the pound, such changes are insignificant. In general, the non-commercial group still has almost 2.5 times more contracts for shorts than longs. This means that the mood of professional traders is now "pronounced bearish". Thus, this is another factor that speaks in favor of the continuation of the pound's fall. The situation with COT reports for the pound is completely different than for the euro. According to the pound, the mood of the major players changes every couple of months, and sometimes even more often. At this time, the net position of the non-commercial group has already fallen to the levels where the last round of the pound's fall ended (the green line on the first indicator). Thus, we can even assume that in the coming weeks the pound will try to start a new ascent. However, the current fundamental and geopolitical background does not give good reasons to expect a strong growth of the British currency. Even taking into account the rate increase by the Bank of England.
We recommend to familiarize yourself with:
Overview of the EUR/USD pair. April 14. The euro is at death's door. There is almost no chance of recovery.
Overview of the GBP/USD pair. April 14. Inflation in Britain is rising, the Bank of England wants to raise rates, but will the economy allow it?
Forecast and trading signals for EUR/USD on April 14. Detailed analysis of the movement of the pair and trading transactions.
GBP/USD 1H

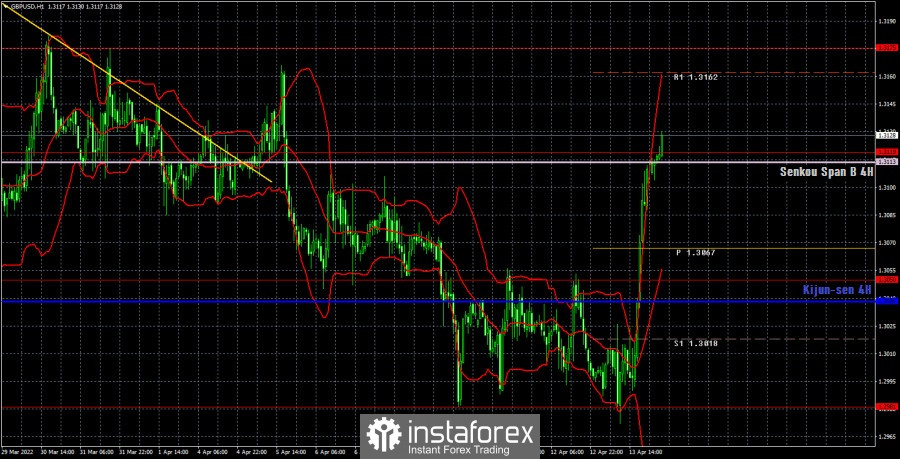
The pound jumped off the bat on the hourly timeframe, but is still located below the Senkou Span B. Therefore, there is a good chance that a rebound will occur from this line, which will provoke a resumption of the downward movement. We do not believe that the 1.2981 level will still stand after two attempts to overcome it. We do not believe that yesterday's growth was so necessary and justified, from a fundamental point of view. We highlight the following important levels on April 14: 1.2981, 1.3050, 1.3119, 1.3175. The Senkou Span B (1.3113) and Kijun-sen (1.3038) lines can also be signal sources. Signals can be "bounces" and "breakthroughs" of these levels and lines. It is recommended to set the Stop Loss level to breakeven when the price passes in the right direction by 20 points. The lines of the Ichimoku indicator can move during the day, which should be taken into account when determining trading signals. There are also support and resistance levels on the chart that can be used to take profits on transactions. There are no important events and publications scheduled for Thursday in Great Britain. And only one important report will be released in the United States – on retail sales. Nevertheless, it is now important that yesterday's growth is completed in order to understand where the pair is now and what to expect from it in the coming days. The growth of the pound turned out to be quite strong, but what will happen next if there is still no fundamental support?
Explanations for the chart:
Support and Resistance Levels are the levels that serve as targets when buying or selling the pair. You can place Take Profit near these levels.
Kijun-sen and Senkou Span B lines are lines of the Ichimoku indicator transferred to the hourly timeframe from the 4-hour one.
Support and resistance areas are areas from which the price has repeatedly rebounded off.
Yellow lines are trend lines, trend channels and any other technical patterns.
Indicator 1 on the COT charts is the size of the net position of each category of traders.
Indicator 2 on the COT charts is the size of the net position for the non-commercial group.
 English
 Русский
 Bahasa Indonesia
 Bahasa Malay
 ไทย
ไทย Español
 Deutsch
 Български
 Français
 Tiếng Việt
 中文
中文 বাংলা
বাংলা हिन्दी
 Čeština
 Українська
 Română

