 English
  Русский
 Bahasa Indonesia
 Bahasa Malay
 ไทย
ไทย Español
 Deutsch
 Български
 Français
 Tiếng Việt
 中文
中文 বাংলা
বাংলা हिन्दी
 Čeština
 Українська
 Română

Trend analysis (fig.1)
On Wednesday, the pair may advance to an upward target of 1.0866, the Fibonacci retracement level of 14.6% (red dotted line) from the level of 1.0826 (the closing of yesterday's daily candlestick. After testing this level, the price may grow to the target level of 1.0899, the Fibonacci retracement level of 23.6% (red dotted line). If this scenario comes true, it is likely to rise higher.
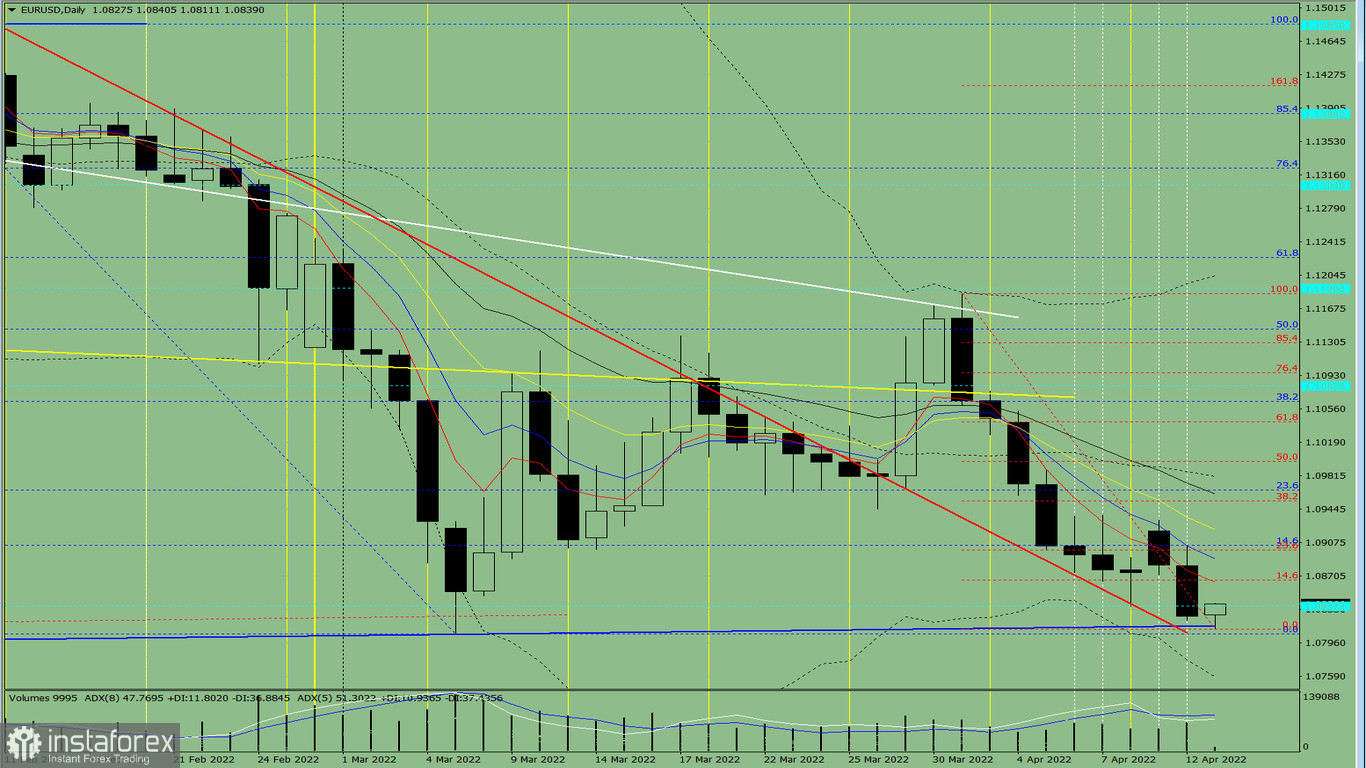
Fig. 1 (daily chart).
Complex analysis:
- indicator analysis– up;
- Fibonacci retracement levels – up;
- trading volumes – up;
- candlestick analysis – up;
- trend analysis – up;
- Bollinger bands – down;
- weekly chart-up.
Conclusion:
Today, the pair may advance to an upward target of 1.0866, the Fibonacci retracement level of 14.6% (red dotted line) from the level of 1.0826 (the closing of yesterday's daily candlestick. After testing this level, the price may grow to the target level of 1.0899, the Fibonacci retracement level of 23.6% (red dotted line). If this scenario comes true, it is likely to rise higher.
Alternatively, the pair may drop to the target level of 1.0758, the lower limit of the Bollinger line indicator (black dotted line) from the level of 1.0826 (closing of yesterday's daily candlestick). After testing this level, the price may jump to an upward target of 1.0866, the Fibonacci retracement level of 14.6% (red bold line).