 English
  Русский
 Bahasa Indonesia
 Bahasa Malay
 ไทย
ไทย Español
 Deutsch
 Български
 Français
 Tiếng Việt
 中文
中文 বাংলা
বাংলা हिन्दी
 Čeština
 Українська
 Română

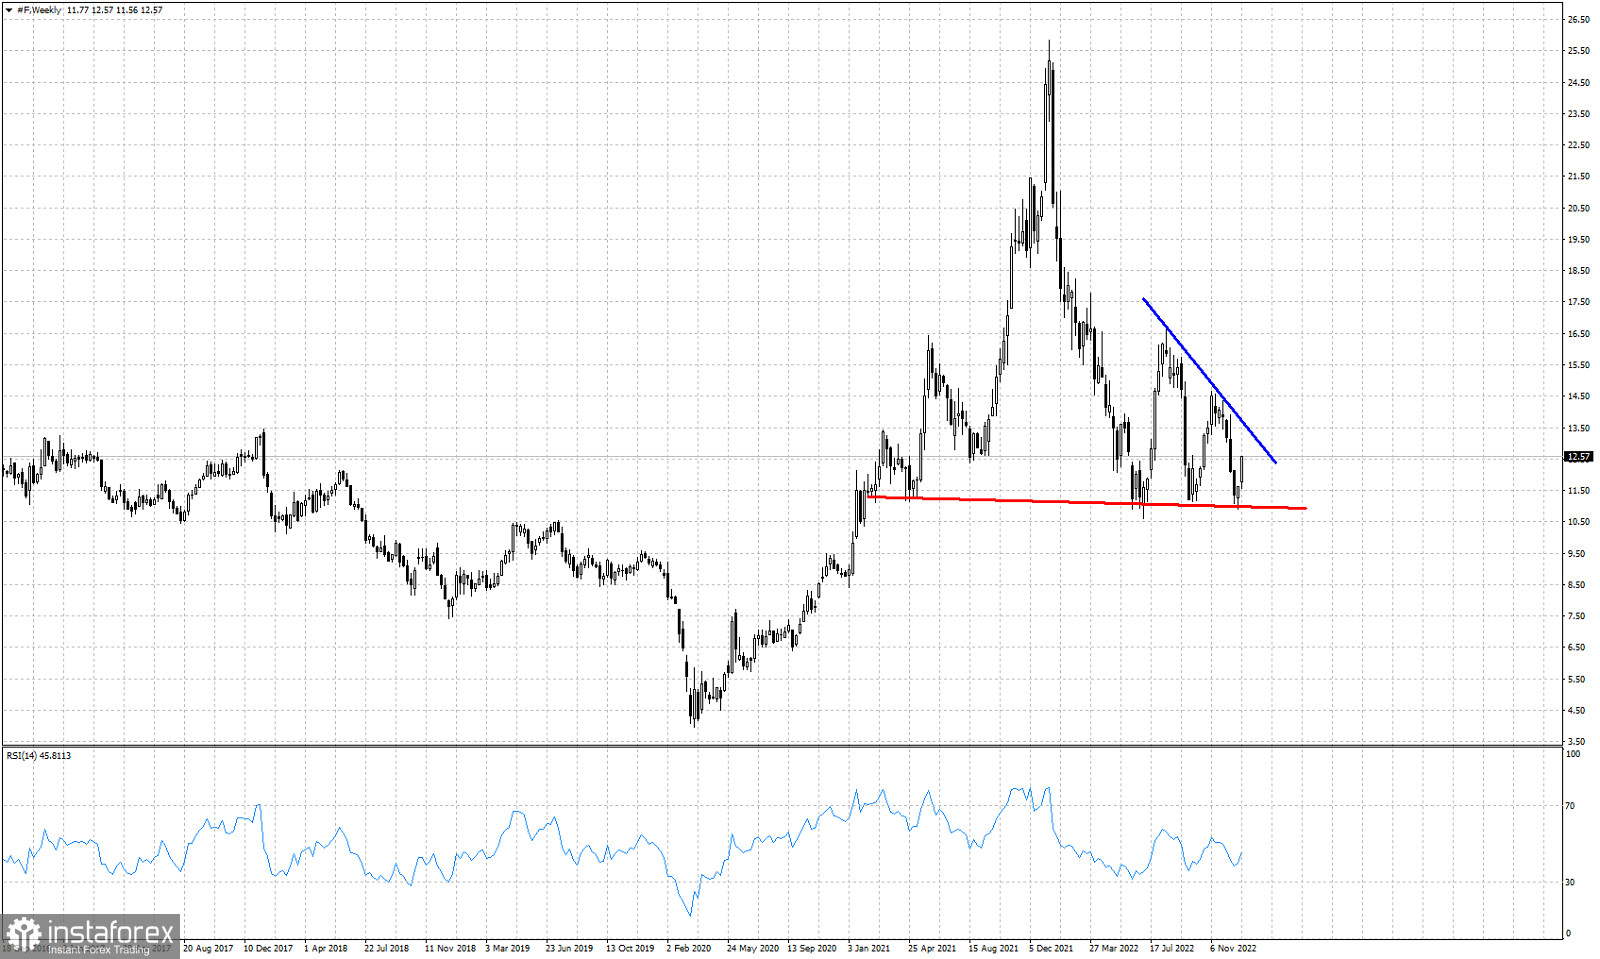
Blue line- resistance trend line
Red line- neckline support
Ford stock price closed last week near its weekly high around $12.57. Price continues to respect the horizontal support neck line at $11 after a third test over the last 10 months. Price has been forming lower highs after each test and bounce. Resistance now is at $13.70. This formation looks more like a bearish Head and Shoulders pattern. For the bearish pattern to provide a bearish signal we need to see price break the red horizontal support. Since support is being respected, bulls continue to have hopes for a move higher. A break above the resistance trend line at $13,70 would be a very positive sign. Currently the most probable outcome would be for price to reach the blue trend line and form another lower high.