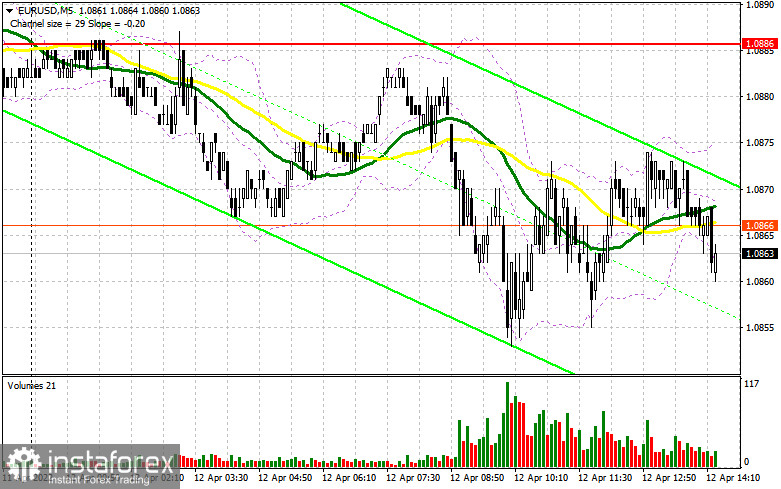
Quite versatile fundamental statistics in the first half of the day for the eurozone did not allow traders to take a clear position, which led to a fairly low trading volume and the same market volatility. In my morning forecast, I paid attention to the level of 1.0886 and recommended making decisions on entering the market. Let's take a look at the 5-minute chart and figure out what happened. The attempt of growth to this resistance at the very beginning of the European session was not entirely successful, as the inflation data in Germany did not surprise. As a result, I did not wait for the formation of a false breakdown from this level to open short positions. We also fell short of the nearest support of 1.0839. For this reason, the technical picture for the afternoon, as well as the strategy, have not changed in any way. And what were the entry points for the pound this morning?

To open long positions on EURUSD, you need:
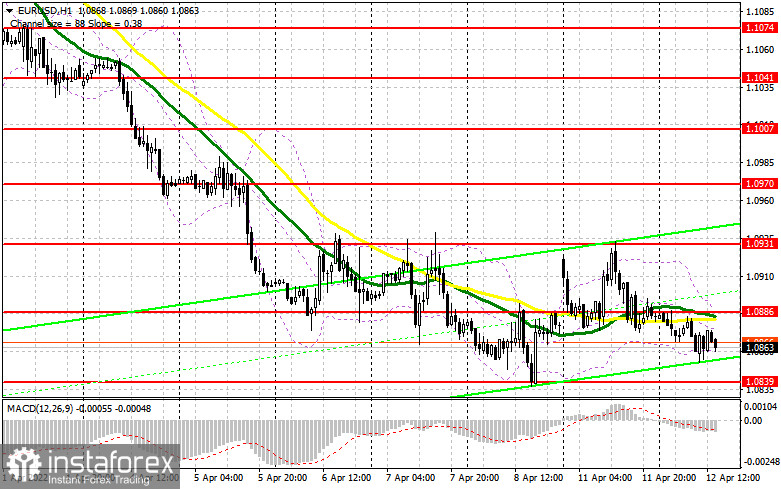
Surprisingly, the data on the index of business sentiment in Germany and the eurozone from the ZEW institute, although it showed another contraction in March, which is bad for the economy, the indicators turned out to be better than the forecasts of economists who expected a worse picture. As a result, this allowed us to stay within the side channel, which I described in detail in my morning forecast. During the American session, we are waiting for a rather important report on inflation in the United States. It is expected that the consumer price index in the United States in March this year will rise immediately to 8.5% per annum against 7.9% in February. If the data exceed the forecasts of economists, this will have a certain negative impact on the European currency, allowing the US dollar to strengthen its position. Therefore, the primary task of the bulls during the American session will be to protect the support of 1.0839. Only a false breakdown at this level will give the first signal to enter the euro against the bear market observed since the end of last month. However, it will be possible to say that buyers have won in a difficult situation when there is a struggle with inflation in the US and the eurozone, and pessimism is hovering in the geopolitical arena, only after the bulls make a successful attempt to return the 1.0886 resistance formed by the results of yesterday to control. A breakout and a reverse test from top to bottom of this level, where the moving averages playing on the sellers' side also pass, will lead to another signal to buy the euro to return to the large resistance of 1.0931, which limits the upward potential of the pair. Going beyond 1.0931 will hit the bears' stop orders, which will allow building a larger upward correction to the area of the highs: 1.0970 1.1007. If the pair falls and there are no bulls at 1.0839, it is best to postpone long positions. The optimal scenario for buying would be a false breakdown of the minimum in the area of 1.0810, but it is possible to open long positions on the euro immediately for a rebound only from 1.0772, or even higher - in the area of 1.0728 with the aim of an upward correction of 30-35 points inside the day.
To open short positions on EURUSD, you need:
Sellers failed to cope with all the tasks set, but they managed to keep the pair below 1.0886 under their control, which is already good. While trading will be conducted below 1.0886, the probability of a decline in the euro will remain quite high, but if the bears lose this level, everything will turn upside down. The formation of a false breakdown at 1.0886 in the afternoon after the release of strong inflation statistics in the US will lead to a sell signal followed by a decline to the support area of 1.0839 formed at the end of last week. A return to this range can seriously harm the plans of buyers, forcing them to move lower. A breakthrough and a reverse test of 1.0839, together with hawkish statements by FOMC member Lael Brainard, will give an additional signal to open short positions with the prospect of a decline to a minimum of 1.0810. A more distant target will be the 1.0772 area, where I recommend fixing the profits. If the euro rises and there are no bears at 1.0886, the bulls will try to increase long positions based on the upward correction of the pair. But, given that much will now depend on the further development of geopolitical events, it is better not to bet on the growth of the euro in the current conditions. The optimal scenario will be short positions when forming a false breakdown in the area of 1.0931. You can sell EUR/USD immediately for a rebound from 1.0970, or even higher - around 1.1007 with the aim of a downward correction of 25-30 points.

The COT report (Commitment of Traders) for April 5 recorded an increase in both short and long positions, and, remarkably, there were more buyers than sellers. All this is characterized by positive expectations of new measures from the European Central Bank, which has recently been talking a lot about the need for a tighter monetary policy. However, the lack of positive dynamics in the negotiations between Russia and Ukraine and the growth of geopolitical tensions continue to negatively affect the euro, which does not allow the bulls to build even a normal upward correction. In the near future, we expect important data on inflation in the eurozone and the United States. The reports will contain more objective figures on the rate of price growth after the start of the Russian military special operation. This will give investors and politicians more guidance on how to proceed with monetary policy, which will partially determine the further direction of the EUR/USD pair. The COT report indicates that long non-commercial positions increased from the level of 200,043 to the level of 210,914, while short non-commercial positions increased from the level of 178,669 to the level of 183,544. Considering that the growth of short positions turned out to be less impressive than the growth of long ones, at the end of the week the total non-commercial net position increased to 27,370 against 21,374. The weekly closing price dropped to 1.0976 from 1.0991.
Signals of indicators:
Moving averages
Trading is conducted below 30 and 50 daily moving averages, which indicates a high probability of a further fall in the euro.
Note. The period and prices of moving averages are considered by the author on the hourly chart H1 and differ from the general definition of the classic daily moving averages on the daily chart D1.
Bollinger Bands
In the case of growth, the upper limit of the indicator around 1.0890 will act as resistance. A break of the lower limit of the indicator in the area of 1.0852 will lead to a larger drop in the pair.
Description of indicators
- Moving average (moving average determines the current trend by smoothing out volatility and noise). Period 50. The graph is marked in yellow.
- Moving average (moving average determines the current trend by smoothing out volatility and noise). Period 30. The graph is marked in green.
- MACD indicator (Moving Average Convergence / Divergence - moving average convergence/divergence) Fast EMA period 12. Slow EMA period 26. SMA period 9
- Bollinger Bands (Bollinger Bands). Period 20
- Non-profit speculative traders, such as individual traders, hedge funds, and large institutions use the futures market for speculative purposes and to meet certain requirements.
- Long non-commercial positions represent the total long open position of non-commercial traders.
- Short non-commercial positions represent the total short open position of non-commercial traders.
- Total non-commercial net position is the difference between the short and long positions of non-commercial traders.
 English
 Русский
 Bahasa Indonesia
 Bahasa Malay
 ไทย
ไทย Español
 Deutsch
 Български
 Français
 Tiếng Việt
 中文
中文 বাংলা
বাংলা हिन्दी
 Čeština
 Українська
 Română

