Analysis of Monday's deals:
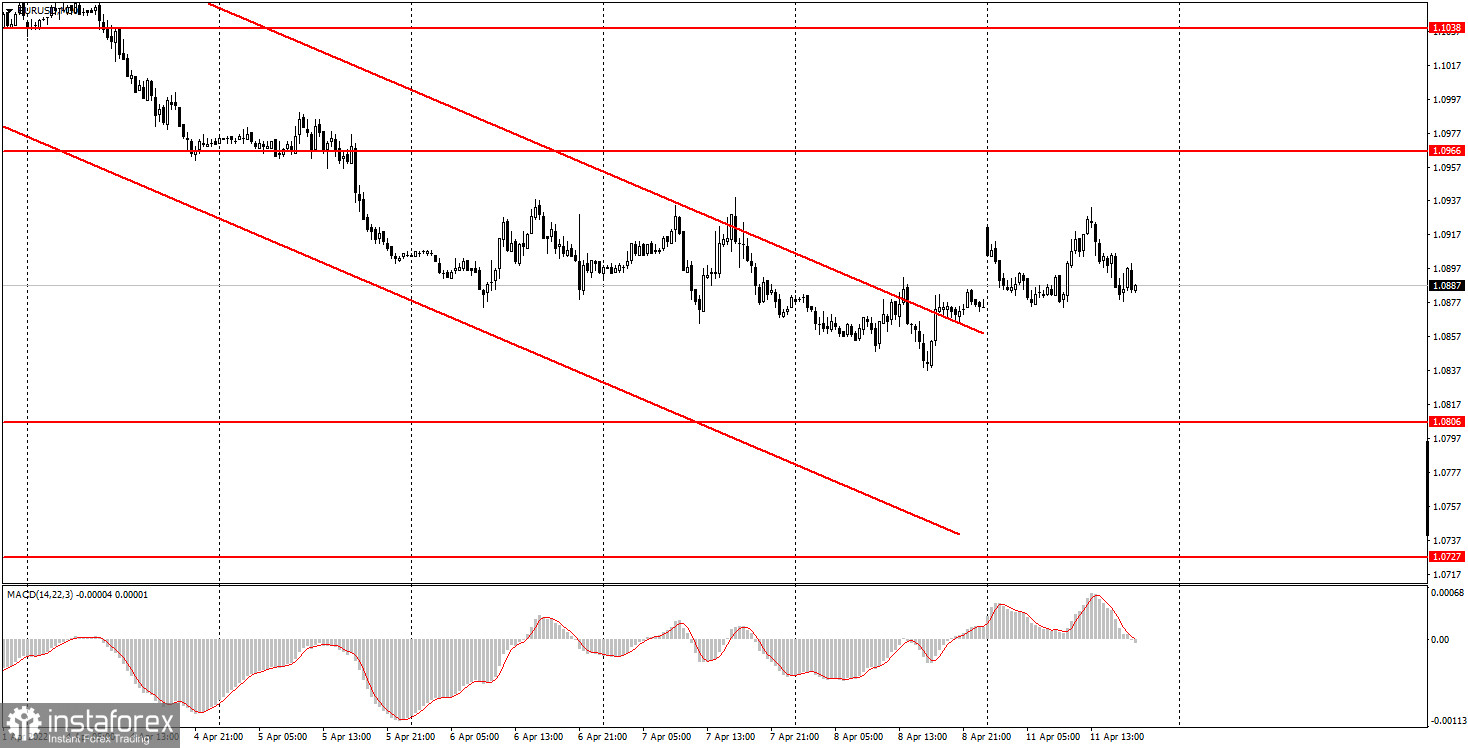
30M chart of the EUR/USD pair.

The EUR/USD currency pair did not show anything special on Monday. A typical flat or "swing". On the one hand, this behavior of the pair is quite logical, since the macroeconomic and fundamental background in the European Union and America was absent on Monday. In principle, the second half of last week was also held in very vague auctions, which is seen in the illustration above. The price left the descending channel very quickly, but we warned traders that this channel is quite formal, and overcoming it will not necessarily mean that an upward trend will begin. At the moment, the euro/dollar pair is still very low, close to its local and 15-month lows. And since the fundamental, macroeconomic and geopolitical background is not improving, it is unlikely to expect strong growth of the euro currency. Corrective growth is possible, but the last month and a half have shown well how much the pair can adjust in the current conditions. On Monday, only the results of the first round of the French presidential election can be noted, which means that Emmanuel Macron is likely to remain president, and France's course within the European Union will remain unchanged. Recall that there are certain chances of victory for Marine Le Pen, who is a representative of the "left forces". If she wins in France, a break with the European Union may be initiated, as happened in the UK in 2016.
5M chart of the EUR/USD pair.
On the 5-minute timeframe, the movement on Monday again looks like a typical flat. All day, the pair was between the levels of 1.0874 and 1.0938, that is, approximately in the 70-point side channel. The level of 1.0874 is the minimum of today, so it did not participate in the formation of trading signals. Therefore, all the signals of the day were formed around the level of 1.0902, which was removed from the chart as a result. The first buy signal was formed during the European trading session and after that, the price went up by only 20 points, without working out the target level of 1.0938. This was enough to set the Stop Loss to breakeven, at which the purchase transaction was closed. The next sell signal was formed at the beginning of the American session, after which the price went down 15 points, which was also enough to set the Stop Loss to breakeven. However, this time the deal could be closed at a minimum profit near the 1.0874 level manually. Therefore, novice traders could still earn 10-15 points of profit today.
How to trade on Tuesday:
In the 30-minute timeframe, the downward trend persists, although the pair have already left the descending channel. Nevertheless, it will be possible to talk about an upward trend no earlier than the formation of a trend line or channel that will support traders to increase. Most factors continue to be in favor of the dollar, so we believe that the euro will continue its decline. On the 5-minute TF tomorrow, it is recommended to trade by levels 1.0769, 1.0806, 1.0837, 1.0874, 1.0938, 1.0966, and 1.0989. When passing 15 points in the right direction, you should set the Stop Loss to breakeven. On Tuesday, the European Union will publish only the index of the mood in the business environment, which in the current circumstances is unlikely to cause anyone special interest. In America, there is a very important inflation report for March, which may show an acceleration to 8.5% y/y. There simply could be no reaction to this report, since this is now the main indicator for the Fed.
Basic rules of the trading system:
1) The strength of the signal is calculated by the time it took to generate the signal (rebound or overcoming the level). The less time it took, the stronger the signal.
2) If two or more trades were opened near a certain level on false signals, then all subsequent signals from this level should be ignored.
3) In a flat, any pair can form a lot of false signals or not form them at all. But in any case, at the first signs of a flat, it is better to stop trading.
4) Trade transactions are opened in the period between the beginning of the European session and the middle of the American session when all transactions must be closed manually.
5) On a 30-minute TF, signals from the MACD indicator can be traded only if there is good volatility and a trend, which is confirmed by a trend line or a trend channel.
6) If two levels are located too close to each other (from 5 to 15 points), then they should be considered as a support or resistance area.
What's on the charts:
Price support and resistance levels - target levels when opening purchases or sales. Take Profit levels can be placed near them.
Red lines - channels or trend lines that display the current trend and show in which direction it is preferable to trade now.
MACD indicator(14, 22, 3) - a histogram and a signal line - an auxiliary indicator that can also be used as a signal source.
Important speeches and reports (always contained in the news calendar) can greatly influence the movement of a currency pair. Therefore, during their exit, it is recommended to trade as carefully as possible or exit the market to avoid a sharp price reversal against the previous movement.
Forex beginners should remember that every trade cannot be profitable. The development of a clear strategy and money management are the keys to success in trading over a long period.
 English
 Русский
 Bahasa Indonesia
 Bahasa Malay
 ไทย
ไทย Español
 Deutsch
 Български
 Français
 Tiếng Việt
 中文
中文 বাংলা
বাংলা हिन्दी
 Čeština
 Українська
 Română

