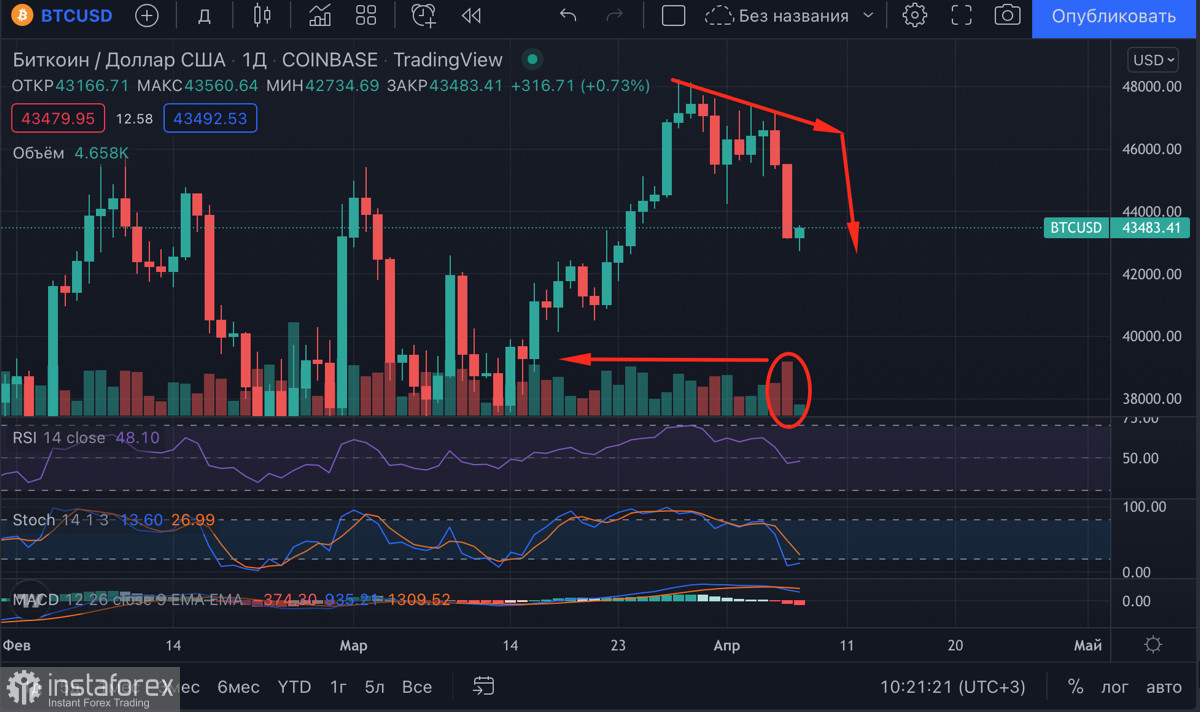
Bitcoin has been within the local uptrend for two weeks. The trend was formed due to increased investment activity of large investors. Subsequently, the cryptocurrency managed to reach a local high of $48,000. BTC failed to move further as the bears increased their resistance. Therefore, the asset began to consolidate. Consequently, the price retested the support level twice. Moreover, it became obvious that the bears strengthened their positions.
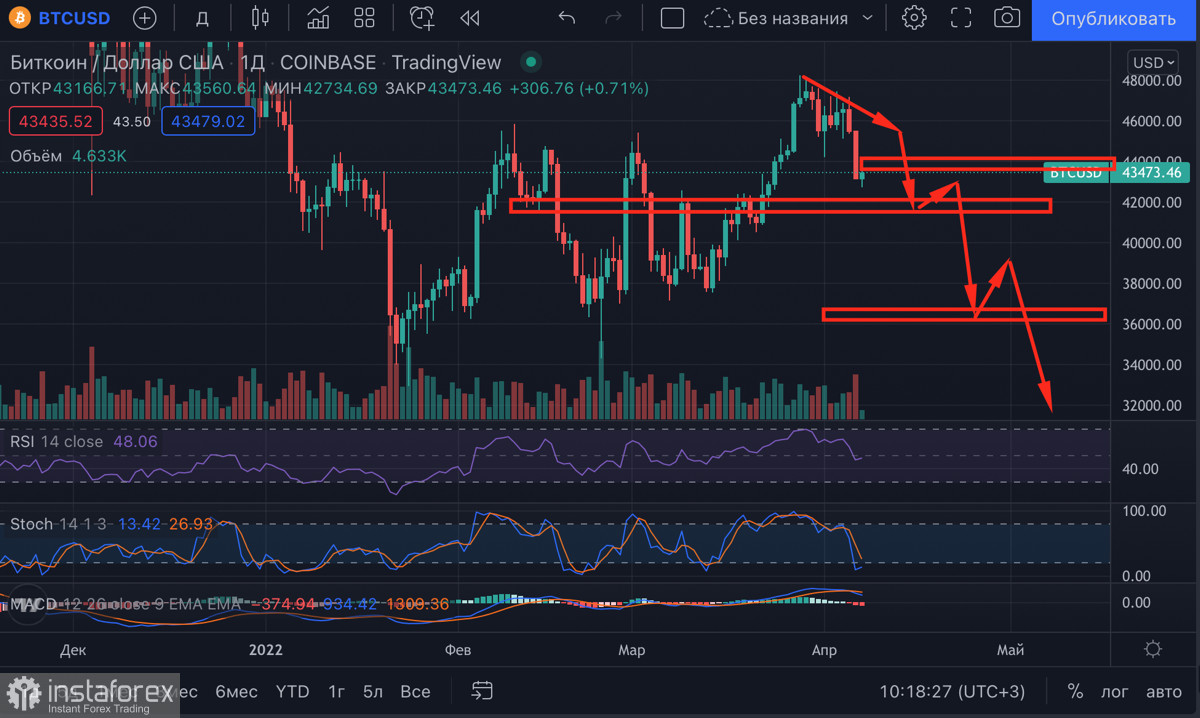
The outcome of the failed retest at $48,000 and failed consolidation was the formation of a large red candle, a clear signal of sellers' dominance in the $44,000-$48,000 price area. The cryptocurrency lost 4% during the day and the weekly capitalization outflow totaled 7%. The main reason why bitcoin failed to maintain a bearish scenario was the return to the range where the coin had been trading for 2.5 months. As of 10:00 am, the asset was trading around $43,400. Therefore, the $44,000-$45,000 area has become a resistance zone with a large number of long positions. This scenario will be irrelevant if the asset manages to climb above $44,000 in the next 24 hours.
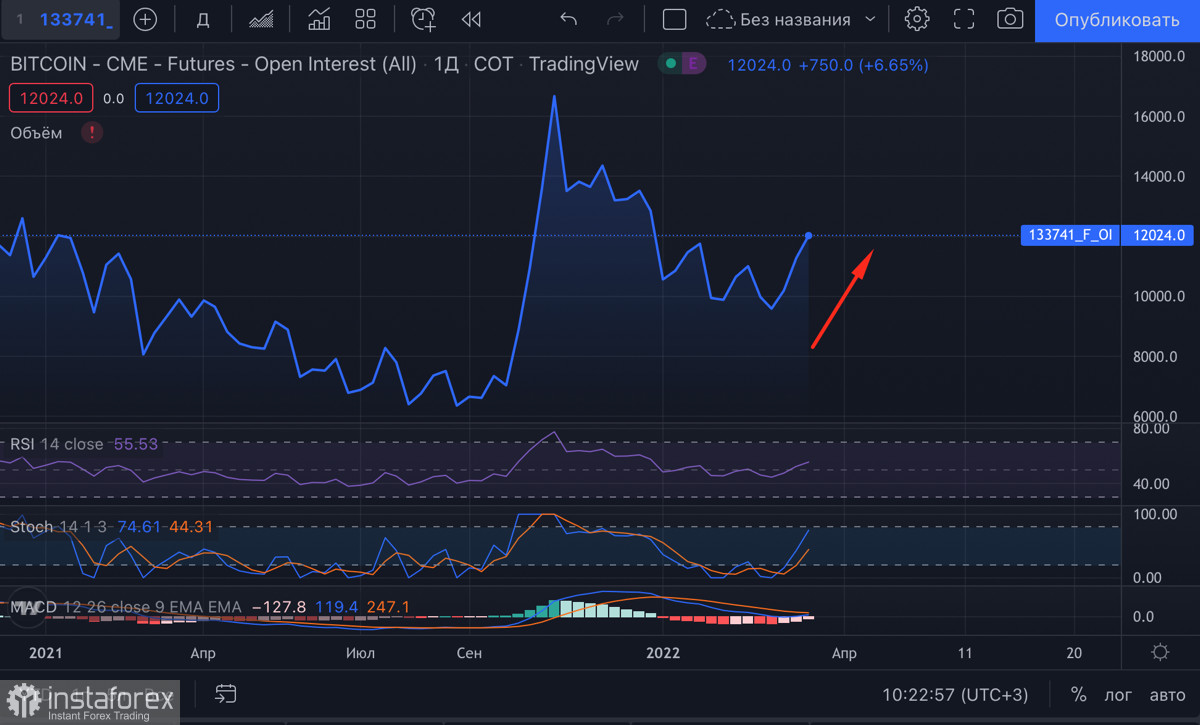
BTC futures have generated considerable interest among traders. On average, around 1,000 Bitcoin coins are transferred into digital wallets per day. At the same time, the price again drops into a wide range of fluctuations. A CryptoQuant analyst noted that there had been a significant spike in profit taking by large investors over the past two days. This suggests that the coming bullish trend is not dominant in the market. Bearish pressure exerted on the BTC/USD pair around $46,000-$48,000 was intensified by profit taking deals.
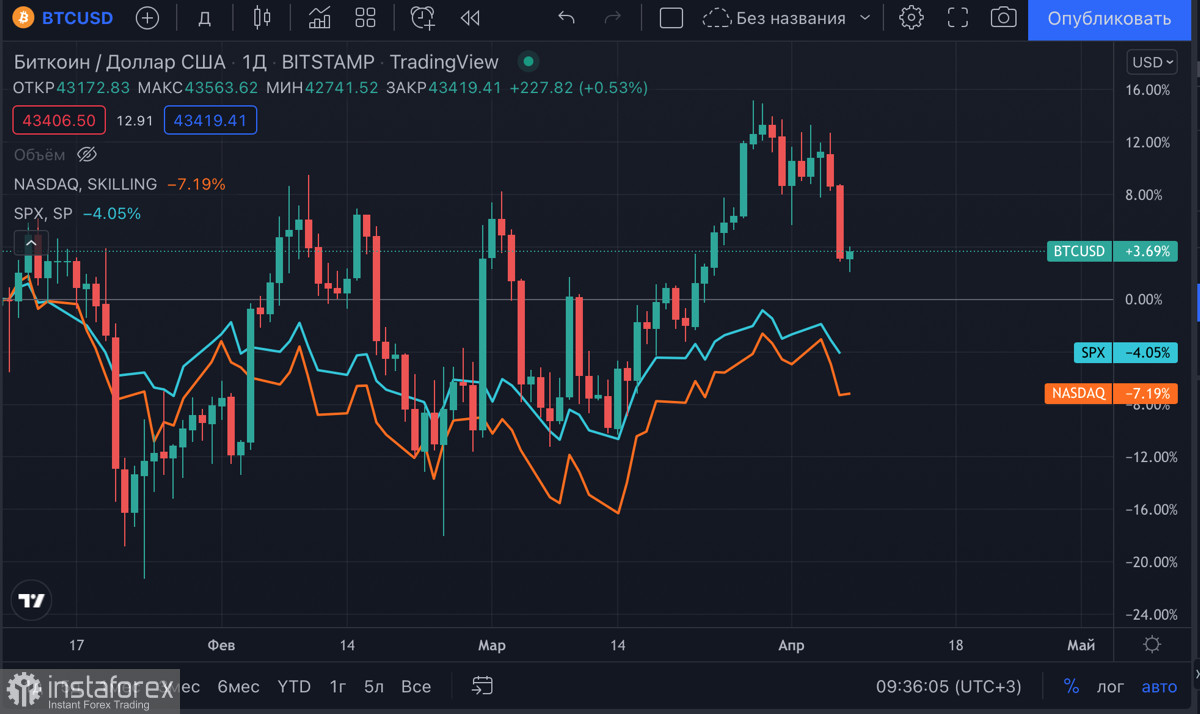
Investors' fear and uncertainty due to the Fed's monetary policy were another major reason for bitcoin's bearish scenario. Over the past six months, the cryptocurrency has increased its correlation between gold and stock indices, for example the SPX and the NASDAQ. Currently, it shows the duality of investors' perception of bitcoin. On the one hand, BTC is an effective safe haven asset, but on the other hand, it is a high-risk and high-return asset. Taking into account the tightening of monetary policy, some investors considering bitcoin as a high-risk instrument fear that BTC will follow the stock indices and collapse as monetary policy tightens. This fact also contributes to record BTC sales, increased by profit taking and correctional pressure. Consequently, a constant shift in liquidity searching for the best trading instrument is common amid the new economic reality.
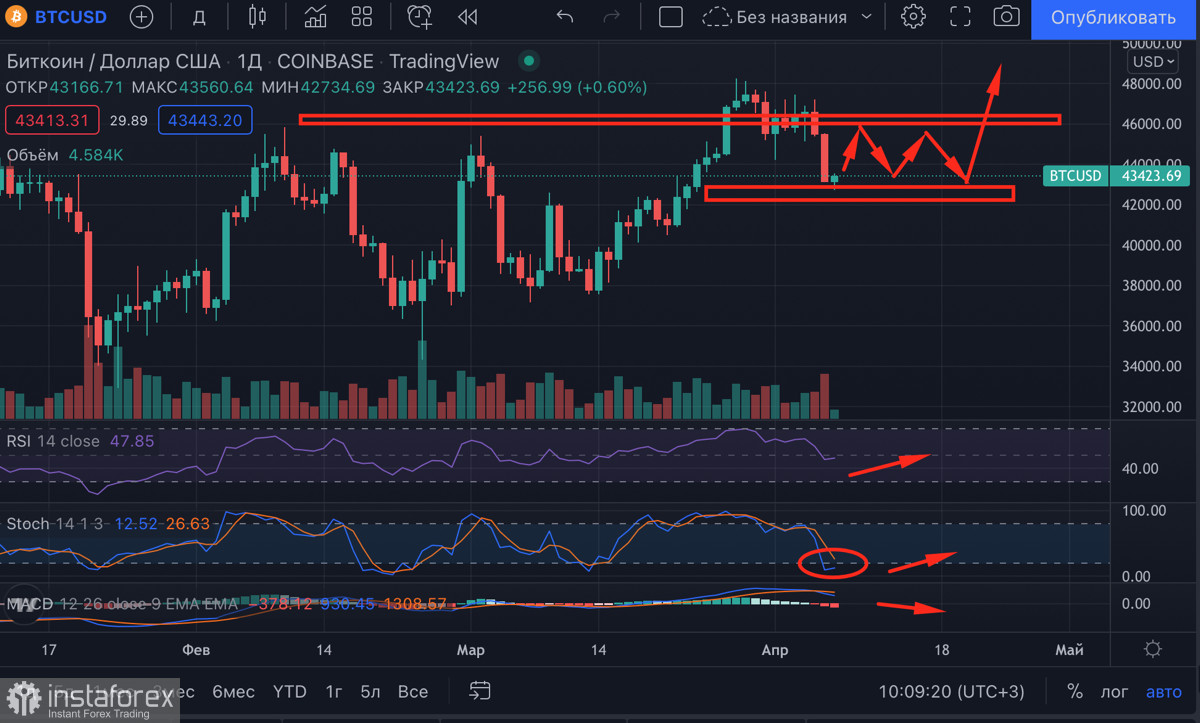
As for investors' pessimistic behavioral patterns regarding BTC, let's discuss several price movement scenarios. In the best-case scenario, the cryptocurrency will resume consolidation in the narrow range of $43,200-$45,500 and subsequently break out to the area of $48,000-$50,000. This fact is confirmed by technical indicators. Both stochastic oscillator and RSI have completed their downward movement and are making a reversal. This suggests that the $43,000 level is bought and the buying activity is increasing. It is a positive signal, indicating BTC potential and bulls' target to move the price up.
In the worst-case scenario, bitcoin will decline to $30,000. A strong bearish candlestick was formed followed by a series of downward movements. The BTC/USD pair closed below $44,000, indicating a breakout of the 0.382 Fibo level. Therefore, the bears may reach the 0.5 level around $36,000. However, the decline is likely to end and the asset will recover if the weekly candlestick closes above $36,400. Otherwise, it is possible for the bears to achieve the next Fibo level, which is below $30,000.
 English
 Русский
 Bahasa Indonesia
 Bahasa Malay
 ไทย
ไทย Español
 Deutsch
 Български
 Français
 Tiếng Việt
 中文
中文 বাংলা
বাংলা हिन्दी
 Čeština
 Українська
 Română

