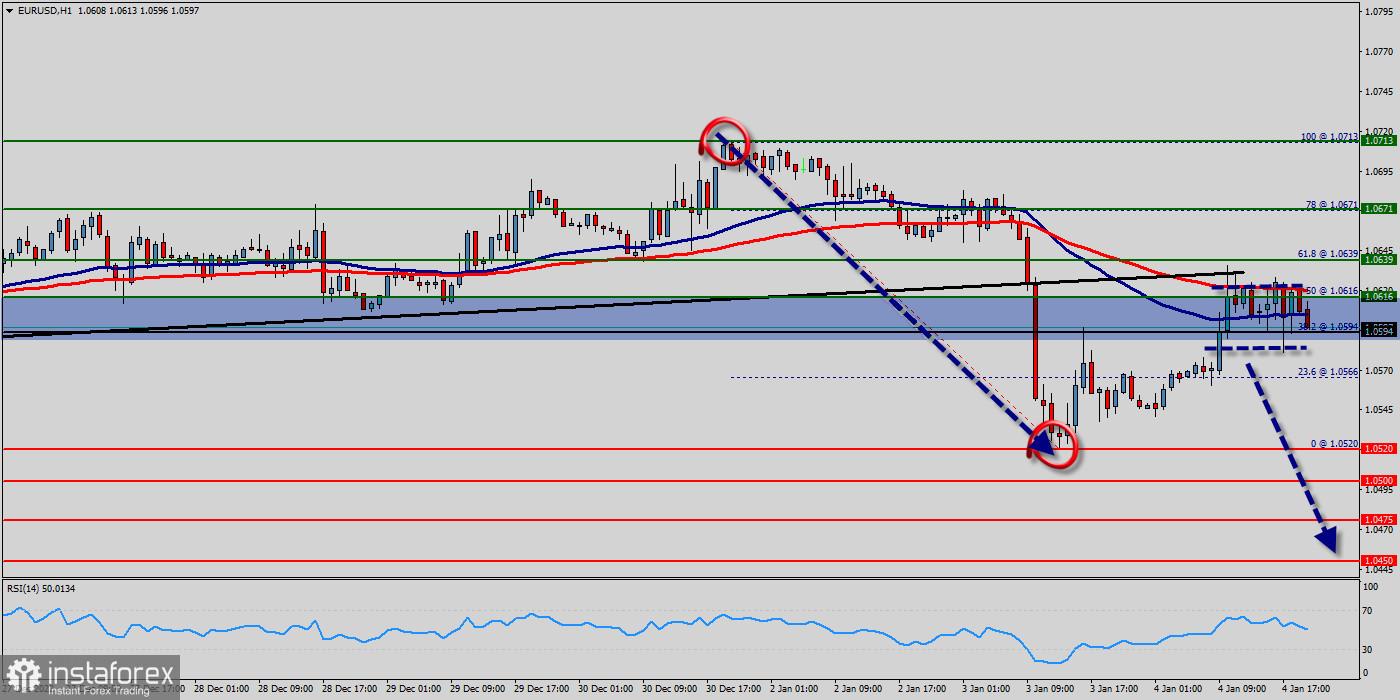
The trend of EUR/USD pair movement was controversial as it took place in the downtrend channel. Due to the previous events, the price is still set between the levels of 1.0713, 1.0671 and 1.0639; so it is recommended to be careful while making deals in these levels because the prices of 1.0639 and 1.0520 are representing the resistance and support respectively.
Therefore, it is necessary to wait till the downtrend channel is passed through. Then the market will probably show the signs of a bearish market. It should be noted that the volatility is very high for that the price of the EUR/USD pair is still trading between the prices of 1.0639 and 1.0520 in the coming hours.
Furthermore, the price has been set below the strong resistance at the levels of 1.0616 and 1.0639 which coincide with the 50% and 61.8% Fibonacci retracement levels respectively.
In other words, sell deals are recommended below the price of 1.0639 with the first target at the level of 1.0520. From this point, the pair is likely to begin an descending movement to the price of 1.0520 with a view to test the daily bottom at 1.0475.
Additionally, currently the price is in a bearish channel. According to the previous events, the pair is still in a downtrend. From this point, the EUR/USD pair is continuing in a bearish trend from the new resistance levels of 1.0639 and 1.0616.
Thereupon, the price spot of .0639 and 1.0616 remains a significant resistance zone. Therefore, the possibility that the Euro will have a downside momentum is rather convincing and the structure of the fall does not look corrective.
The market indicates a bearish opportunity below .0639 and 1.0616 it will be a good signal to sell below .0639 or 1.0616. with the first target of 1.0520. It is equally important that it will call for downtrend in order to continue bearish trend towards 1.0475.
Besides, the weekly support 3 is seen at the level of 1.0450.
However, traders should watch for any sign of a bullish rejection that occurs around 1.0639. The level of 1.0639 coincides with 61.8% of Fibonacci, which is expected to act as a major resistance today. Since the trend is below the 61.8% Fibonacci level, the market is still in a downtrend. Overall, we still prefer the bearish scenario.
Forecast:
If the pair fails to pass through the level of 1.0639 , the market will indicate a bearish opportunity below the strong resistance level of 1.0639. In this regard, sell deals are recommended lower than the 1.0639 level with the first target at 1.0520. It is possible that the pair will turn downwards continuing the development of the bearish trend to the level 1.0475 and 1.450. However, stop loss has always been in consideration thus it will be useful to set it above the last double top at the level of 1.0713.
 English
 Русский
 Bahasa Indonesia
 Bahasa Malay
 ไทย
ไทย Español
 Deutsch
 Български
 Français
 Tiếng Việt
 中文
中文 বাংলা
বাংলা हिन्दी
 Čeština
 Українська
 Română

