Breaking above the 0.7000 mark could be a real challenge.
Hello, dear colleagues!
Here is my overview of NZD/USD. Before I analyze the technical picture, I'd like to say a few words about perhaps the most important event this week – the FOMC meeting. I can assume that it will have a significant impact on the closing price of the current trading week. Should the Federal Reserve become even more hawkish, the US dollar will get stronger versus the basket of major currencies. Otherwise, we may see a sell-off of the greenback as many aspects of the regulator's monetary policy have already been priced in by the market.
Weekly

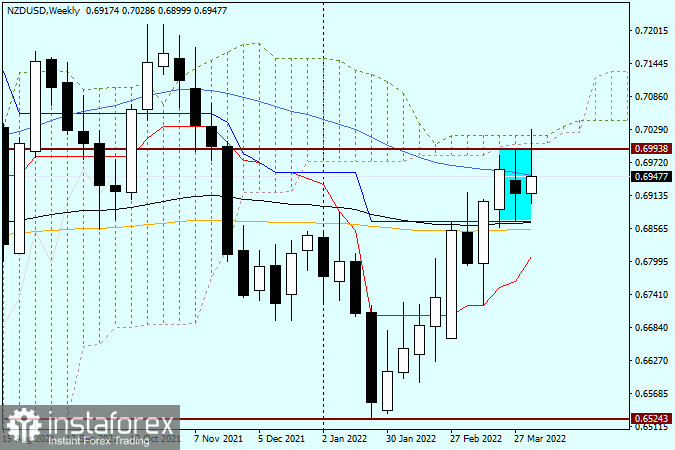
On the weekly chart, we can see the Harami reversal candlestick pattern that emerged last week. Its body is within the body of the previous candlestick. Its long upper and lower shadows confirm the reversal nature of this pattern. Although NZD has been growing against the dollar for two months, the market is not ready for a bearish reversal. At the same time, all attempts of NZD bulls to break through resistance at 0.6993 as well as go above the key psychological and historical level of 0.7000 have so far been unsuccessful. The latest weekly candlestick has acquired a very long upper shadow. This fact indicates that breaking above the mark could be a real challenge. If the price closes above the key level at the end of the trading week, the quote will continue rising. Otherwise, NZD/USD could reverse down.
Daily

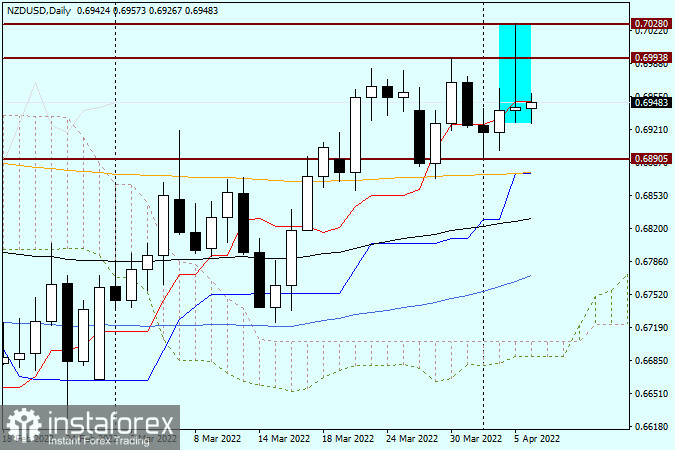
Yesterday's candlestick with a very long upper shadow and a tiny bullish body reflects the strength of resistance encountered by bulls in the price range of 0.6993-0.7028. To continue the bull run, the pair needs to break through 0.7028 and consolidate above it. The red Tenkan Line if the Ichimoku indicator does not allow the quote to extend gains. The release of the FOMC Minutes for March will have a significant impact on the instrument. Technically, yesterday's candlestick gives a sell signal. Therefore, you could look for sell entry points after a short-term increase to the range of 0.6950-0.7000. Traders willing to take a risk could try to sell NZD/USD at the current levels.
Have a nice trading day!
 English
 Русский
 Bahasa Indonesia
 Bahasa Malay
 ไทย
ไทย Español
 Deutsch
 Български
 Français
 Tiếng Việt
 中文
中文 বাংলা
বাংলা हिन्दी
 Čeština
 Українська
 Română

