Crypto Industry News:
The uncertainty caused by the decline in the cryptocurrency market and a series of turbulent bankruptcies is also spreading to the Formula 1 industry, one of the most important cryptocurrency partners.
The declining value of NFTs (Non Fungible Tokens) in F1 has caused Ferrari, one of the well-established F1 teams, to drop support from its crypto-sponsor Velas. By announcing on its website that it had removed Velas from its partner list, Ferrari became the second F1 team after Mercedes to terminate its sponsorship deal with the cryptocurrency company.
Ferrari's removal of the cryptocurrency brand Velas from its list of partners marks another blow to the cryptocurrency industry, which continues to lose ground in F1.
The Italian team announced a partnership with Velas at the end of 2021, at a time when F1 teams seemed eager to make deals with cryptocurrency companies. However, the landscape has changed dramatically over the last twelve months and cryptocurrencies have significantly lost value in the eyes of Formula 1 teams.
Technical Market Outlook:
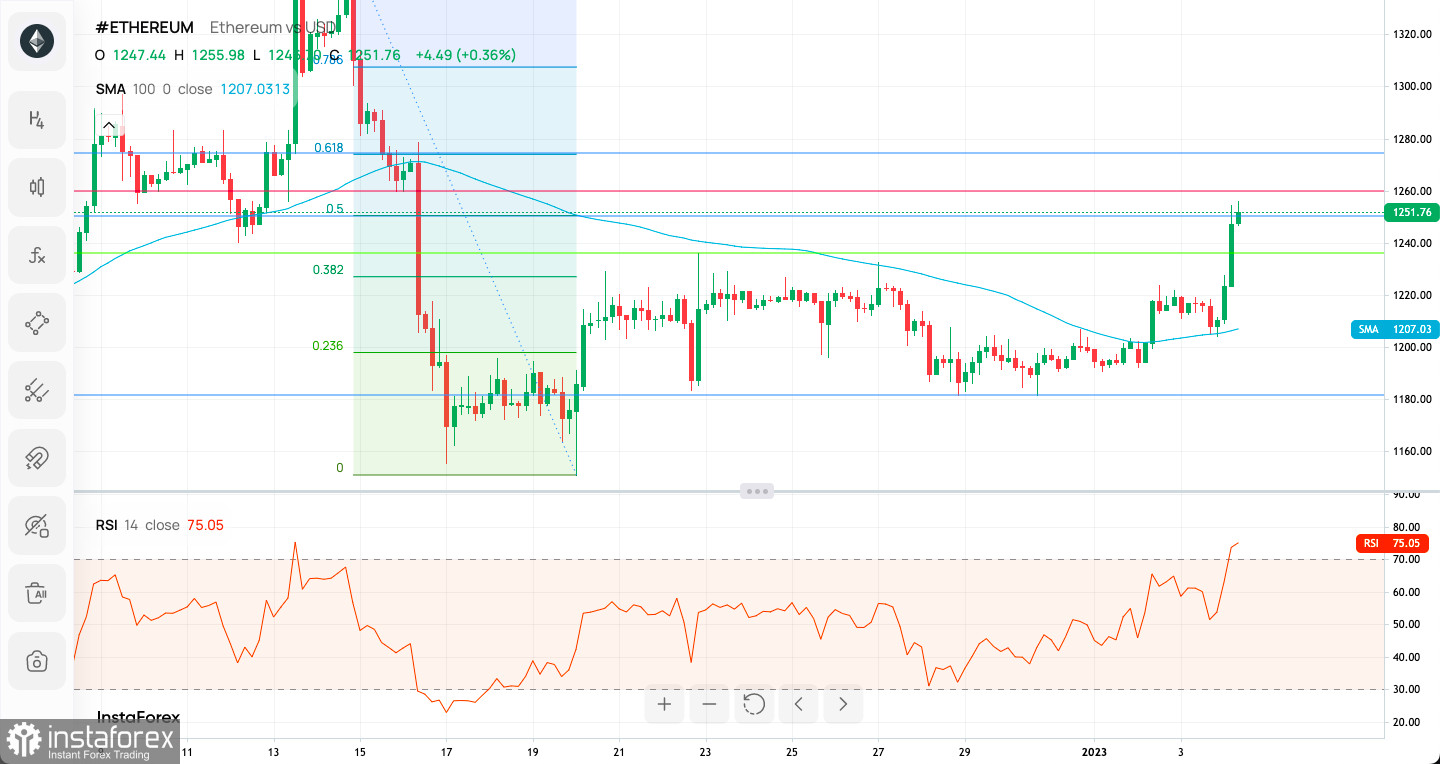
The Ethereum cryptocurrency has retraced 50% of the last wave down on the H4 time frame chart and is currently trading above to this level. The technical resistance is seen at the level of $1,259, so bulls need to break through this level in order to continue the bounce towards the technical resistance seen at $1,278 and 61% Fibonacci retracement level located at $1,274. The key short-term technical support is seen at the level of $1,183. Please notice the spike in the momentum indicator on the H4 time frame chart to the extremely overbought market territory.

Weekly Pivot Points:
WR3 - $1,258
WR2 - $1,232
WR1 - $1,220
Weekly Pivot - $1,205
WS1 - $1,191
WS2 - $1,178
WS3 - $1,152
Trading Outlook:
The Ethereum market has been seen making lower highs and lower low since the swing high was made in the middle of the August 2022 at the level of $2,029. The key technical support for bulls at $1,281 was broken already and the new swing low was established at $1,074. There is a clear test of the 50 WMA located at the level of $1,080, so any breakout below the moving average and a weekly candle close below moving average will be considered as another indication of the down trend continuation. If the down move will be extended, then the next target for bears is located at the level of $1,000.
 English
 Русский
 Bahasa Indonesia
 Bahasa Malay
 ไทย
ไทย Español
 Deutsch
 Български
 Français
 Tiếng Việt
 中文
中文 বাংলা
বাংলা हिन्दी
 Čeština
 Українська
 Română

