Conditions for opening long positions on EUR/USD:
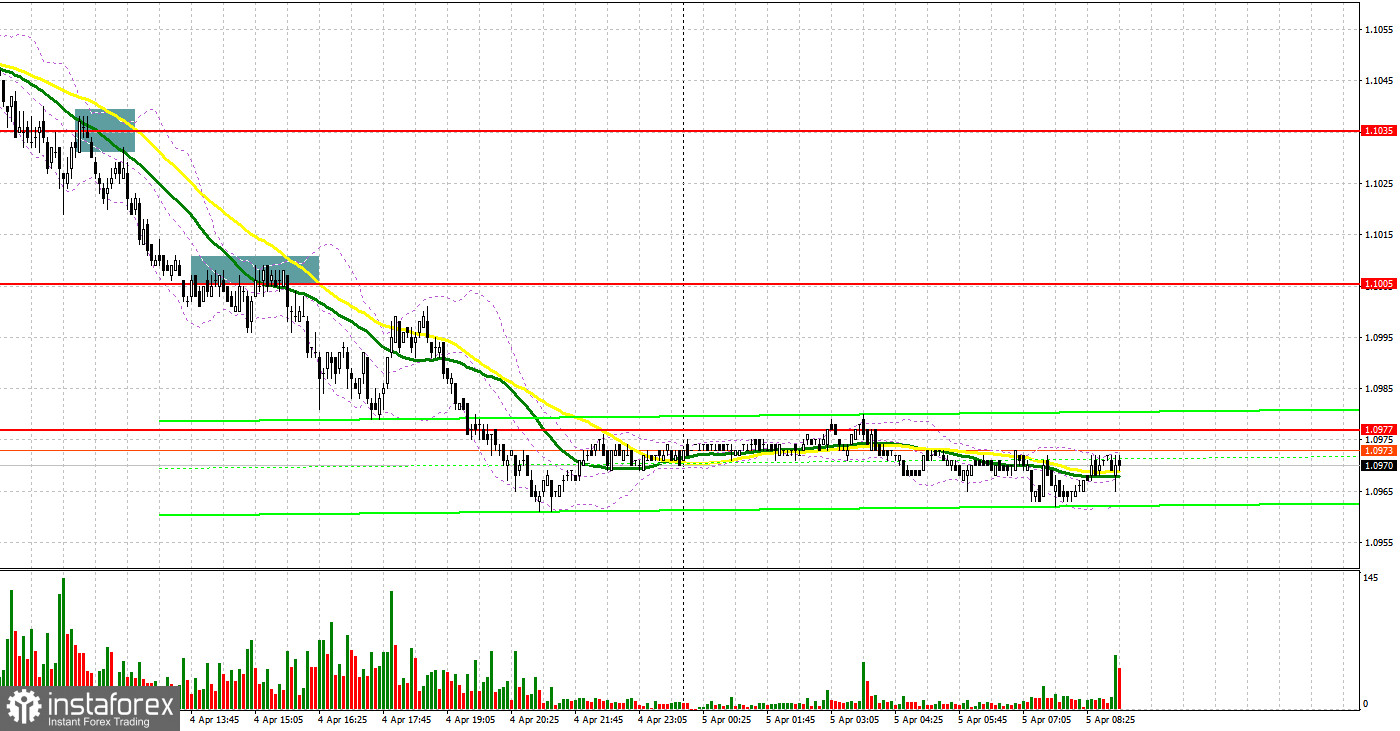
Yesterday, traders received several signals to enter the market, which allowed them to make a profit. Let us focus on the 5-minute chart to clear up the market situation. Earlier, I asked you to pay attention to the level of 1.1031 to decide when to start trading. A decline in the euro/dollar pair and a false break formed a buy signal. However, the price did not start rising. The price upwardly tested 1.1031 amid a decline in the eurozone investor confidence indicator. As a result, traders had a chance to close long positions with minimal losses and sell the euro following a new signal. Those who failed to react quickly received a second chance after the price tested 1.1031. As a result, the pair lost more than 30 pips and touched the support level of 1.1005. Later, the price upwardly tested the level. After the formation of the sell signal, the pair dropped by another 30 pips to the next support level of 1.0977.

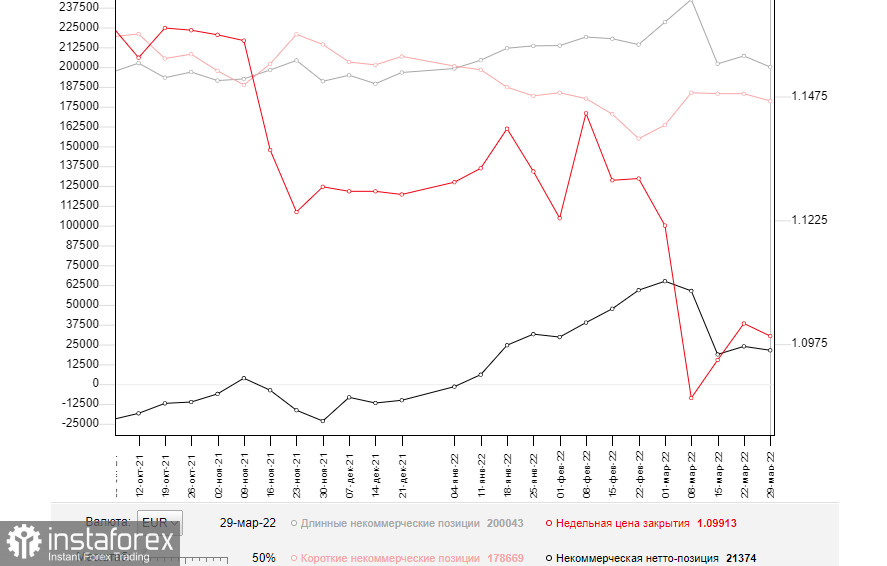
Now, let us switch to the futures market and the COT report. The COT report from March 29 unveiled a decrease in both short and long positions. Notably, the number of buyers who left the market exceeded the number of sellers who decided to stop trading. This fact points to pessimism among market participants caused by the current geopolitical situation. Meanwhile, a risk of higher inflation in the eurozone is the key issue for the ECB. Importantly, inflation has already jumped to 7.5%. Last week, Christine Lagarde several times emphasized the regulator's intention to switch to a more aggressive approach to the QE tapering and key interest rate hike. Against this background, the euro has a good mid-term prospect for growth. At present, the single currency is significantly oversold against the greenback. However, the absence of positive results in the Russia-Ukraine talks and a rise in the geopolitical tension have a negative influence on the euro. Economic problems in the eurozone provoked by extremely high inflation and responsive measures taken by Russia (including payments for gas in rubles) are likely to continue exerting pressure on the euro in the short term. That is why traders will hardly see a considerable increase in the pair. According to the COT report, the number of long non-commercial positions slid to 200,043 from 207,051. At the same time, the number of short non-commercial positions slumped to 178,669 from 183,208. Since a drop in the number of short positions turned out to be more significant, the overall non-commercial net position declined to 21,374 from 23,843. The weekly close price also dropped to 1.0991 from 1.1016.

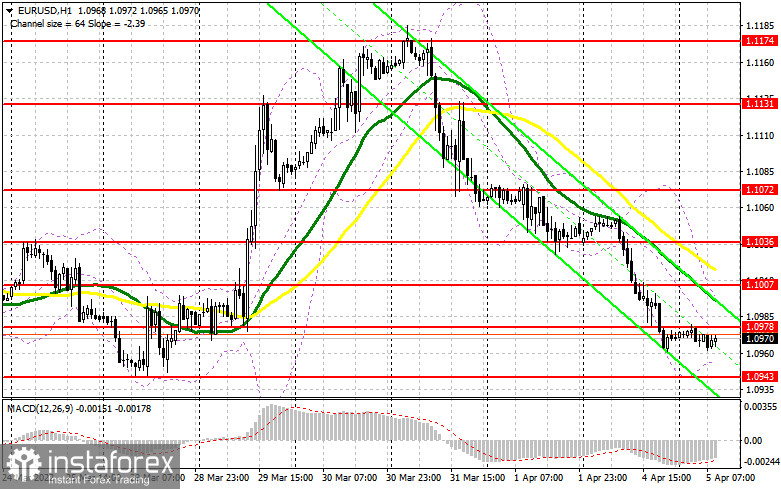
During the European session, the eurozone is going to disclose a lot of macroeconomic reports. Traders are likely to pay close attention to the composite PMI data from Germany, France, Italy,and the whole eurozone. They also may focus on the service PMI reports from these countries. A drop in the indicators may have a negative influence on the euro that has already depreciated. If the real data exceeds forecasts, the pair may break 1.0978. Yesterday, representatives of Russia and Ukraine held a video conference. Judging by the market reaction, the meeting led to zero results. Although the euro/dollar pair is likely to slide today, bulls should protect the support level of 1.0943. The pair may approach this level amid weak macroeconomic reports. Only a false break of this level will give a first signal to buy the euro. If the MACD indicator points to divergence, the pair will have a chance to return to 1.0978. A downward break of this level may give a buy signal, thus allowing the pair to recover to 1.1007. A farther target is located at the high of 1.1036, where it is recommended to lock in profits. If the price breaks this level, it may jump to 1.1072. If the pair falls and bulls fail to protect 1.0943, it will be better to avoid long positions. Traders may start buying the euro after a false break of 1.0903. It will also be possible to go long from 1.0855, expecting a rise of 30-35 pips within one day.
Conditions for opening short positions on EUR/USD:
Yesterday, sellers reached all the goals and today, the pair is likely to go on losing value. Until the pair trades below 1.0978, the likelihood of its depreciation will remain high. However, if bears lose control of this level, the situation may change dramatically. A false break of 1.0978 caused by the publication of weak reports is likely to provide traders with a sell signal with the target at 1.0943. In case the price returns to the mentioned level, buyers may face some problems. A break of 1.0943 will give an additional short signal with the target at the low of 1.0903. A farther target is located at 1.0855, where it is recommended to lock in profits. If the euro grows and bears fail to protect 1.0978, bulls are likely to start opening positions expecting an uptrend. However, under the existing geopolitical conditions, it will be wise not to bet on the euro's growth. It will be better to open short positions after a false break of 1.1007. It is also possible to sell the euro from 1.1036 or higher – from 1.1072, expecting a drop of 20-25 pips.

Signals of indicators:
Moving Averages
Trading is conducted just below the 30- and 50-day moving averages, which indicates that bears are still controlling the market.
Note: The period and prices of moving averages are considered by the author on the one-hour chart that differs from the general definition of the classic daily moving averages on the daily chart.
Bollinger Bands
A break of the lower limit of the indicator located at 1.0950 may cause a drop in the euro. A break of the upper limit of 1.1000 may push the price higher.
Description of indicators
- Moving average (moving average, determines the current trend by smoothing volatility and noise). The period is 50. It is marked in yellow on the chart.
- Moving average (moving average, determines the current trend by smoothing volatility and noise). The period is 30. It is marked in green on the graph.
- MACD indicator (Moving Average Convergence/Divergence - convergence/divergence of moving averages). A fast EMA period is 12. A slow EMA period is 26. The SMA period is 9.
- Bollinger Bands. The period is 20.
- Non-profit speculative traders are individual traders, hedge funds, and large institutions that use the futures market for speculative purposes and meet certain requirements.
- Long non-commercial positions is a total number of long positions opened by non-commercial traders.
- Short non-commercial positions is a total number of short positions opened by non-commercial traders.
- The total non-commercial net position is a difference in the number of short and long positions opened by non-commercial traders.
 English
 Русский
 Bahasa Indonesia
 Bahasa Malay
 ไทย
ไทย Español
 Deutsch
 Български
 Français
 Tiếng Việt
 中文
中文 বাংলা
বাংলা हिन्दी
 Čeština
 Українська
 Română

