Technical Market Outlook:
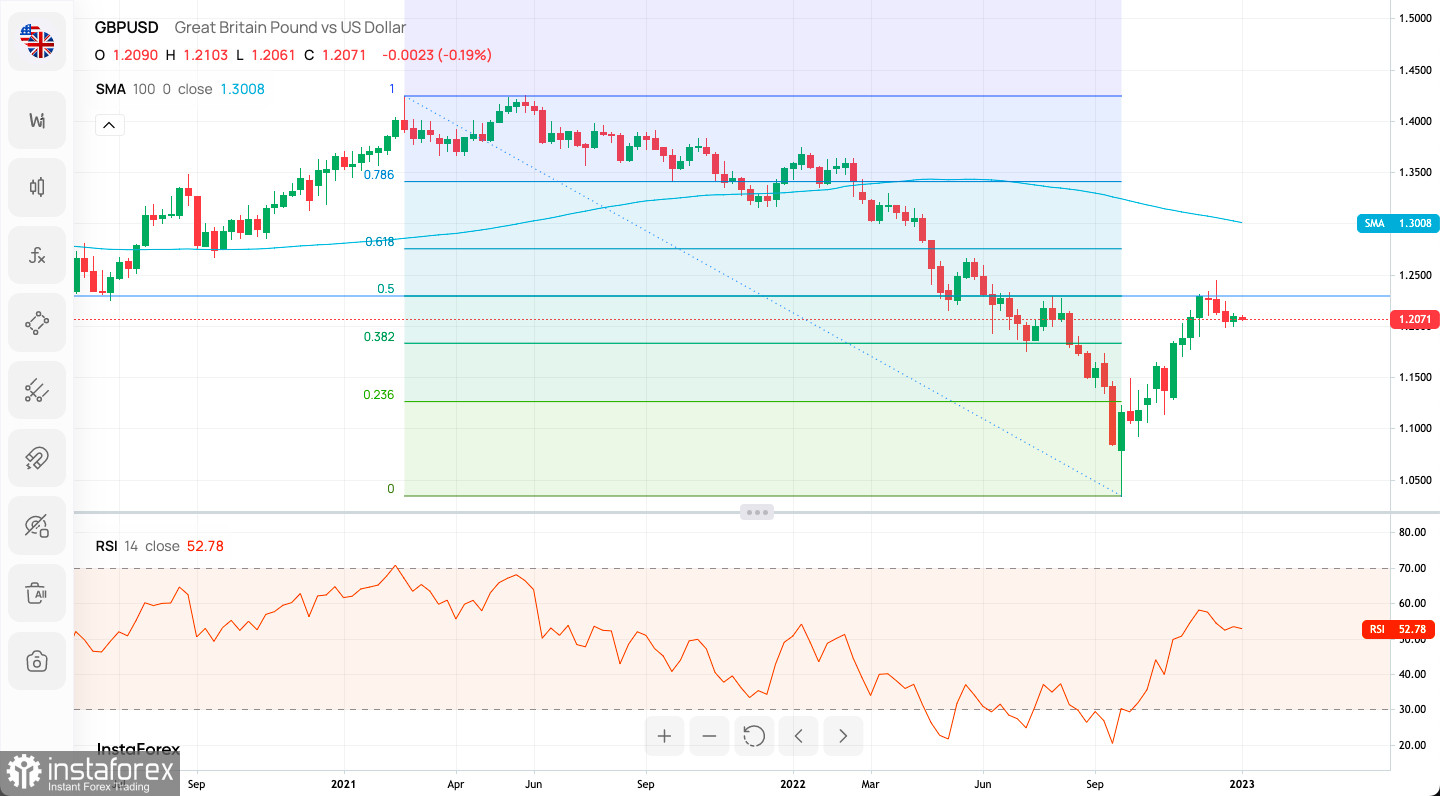
On the weekly time frame chart, the GBP/USD pair has retrace over 50% of the last big wave down and reversed from the level of 1.2309 after the Bearish Engulfing candlestick pattern was made at this time frame. The market still trades below the 100 WMA ( 1.3009), so the long-term and mid-term outlook remains bearish. Any breakout below the level of 1.1658 would confirm the termination of the corrective cycle to the upside and extend the drop towards the swing low located at 1.0371.
On the lower time frames, like H4, the intraday technical support is seen at 1.2000 and the intraday technical resistance can be located at 1.2125.

Weekly Pivot Points:
WR3 - 1.21447
WR2 - 1.21098
WR1 - 1.20893
Weekly Pivot - 1.20749
WS1 - 1.20544
WS2 - 1.20400
WS3 - 1.20051
Trading Outlook:
The bulls are temporary in control of the market and the 50% Fibonacci retracement of the last big wave down located at 1.2293 had been broken, so the next target is 61% Fibonacci retracement level (1.2760). On the other hand, the level of 1.0351 has not been tested since 1985, so the down trend is strong and the recent move up is still being seen as the upwards correction during the down trend. In order to terminate the down trend, bulls need to close the weekly candle above the level of 1.2275 (swing high from August 10th).
 English
 Русский
 Bahasa Indonesia
 Bahasa Malay
 ไทย
ไทย Español
 Deutsch
 Български
 Français
 Tiếng Việt
 中文
中文 বাংলা
বাংলা हिन्दी
 Čeština
 Українська
 Română

