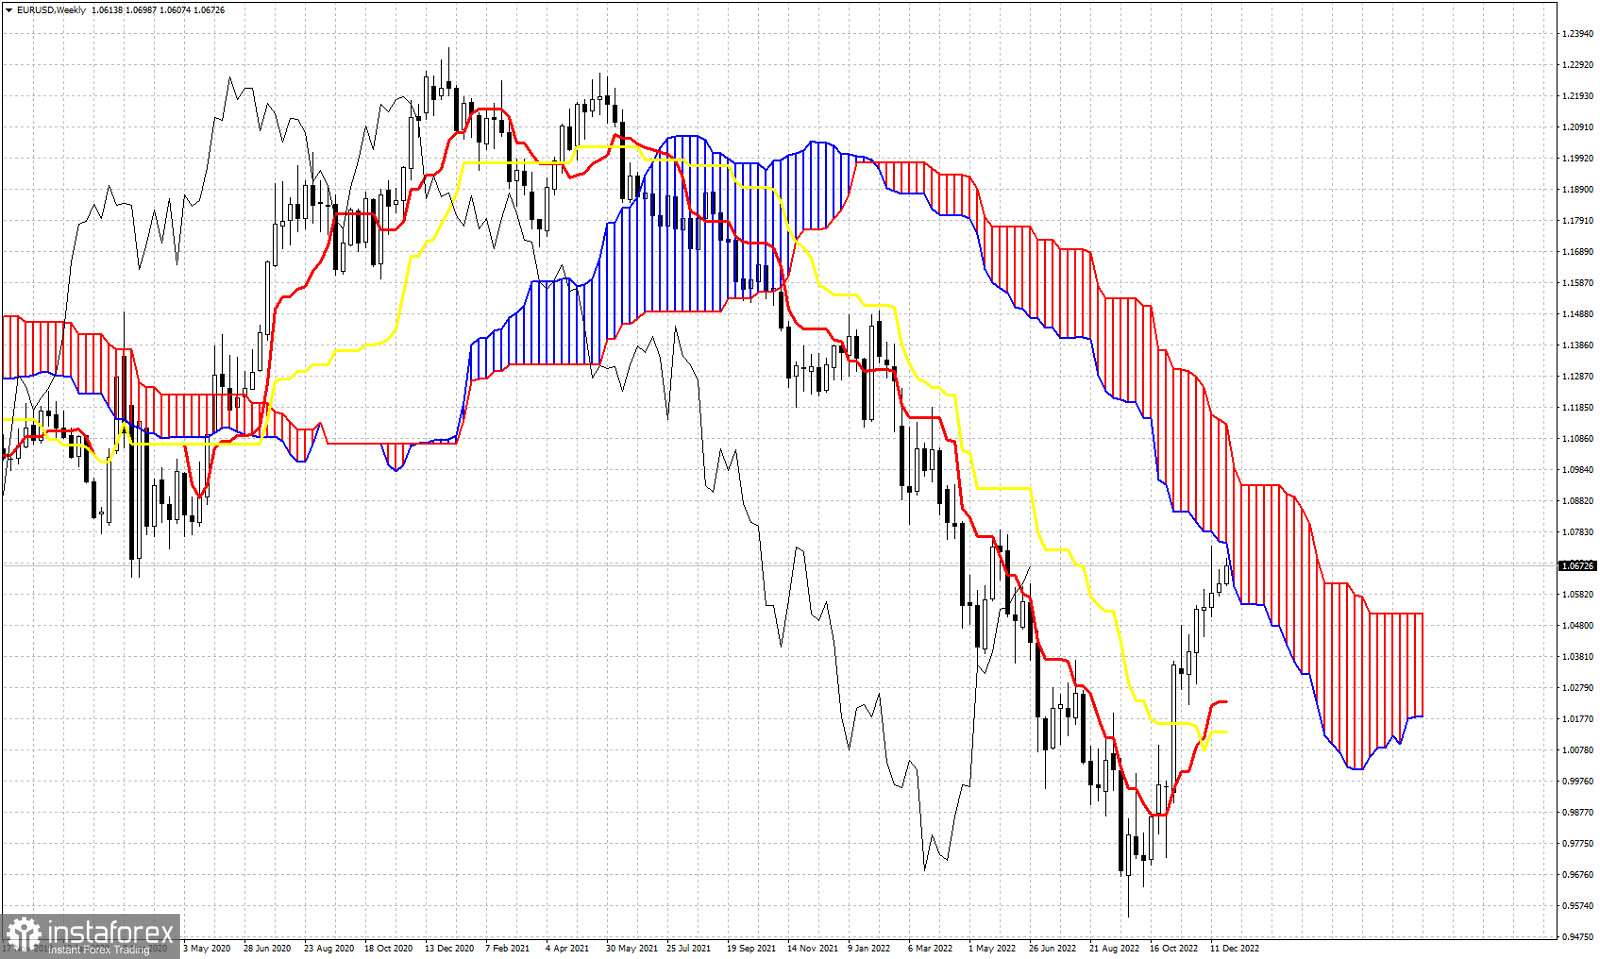
EURUSD is trading at 1.0660-1.0670 area. Price has broken the short-term trading range it was in and is moving higher. Today we use the Ichimoku cloud indicator on a weekly basis to show the importance of the current levels we are currently trading. In Ichimoku cloud terms trend remains bearish on a weekly basis as price is still below the Kumo (cloud). Price is in bullish trend in shorter time frames. Price is above the tenkan-sen (red line indicator) and above the kijun-sen (yellow line indicator). Price is now testing the Kumo resistance at 1.0680. This is an area of important resistance. A rejection at the current levels will lead EURUSD to a pull back towards the tenkan-sen and maybe the kijun-sen. The support by the tenkan-sen is at 1.0240 and by the kijun-sen at 1.0135. A rejection at current levels would be bearish sign. Short-term indicators as discussed in previous posts suggest that a pull back is imminent and highly probable. During holiday season when trading volume is thin, it is better for traders to be patient and not rush into trading. EURUSD has made a remarkable rise from the September 0.9535 lows and the chances for a move even higher are slim. Oscillators are overbought providing bearish divergence warnings. For all the above mentioned reasons, we prefer to be neutral if not bearish.
 English
 Русский
 Bahasa Indonesia
 Bahasa Malay
 ไทย
ไทย Español
 Deutsch
 Български
 Français
 Tiếng Việt
 中文
中文 বাংলা
বাংলা हिन्दी
 Čeština
 Українська
 Română

