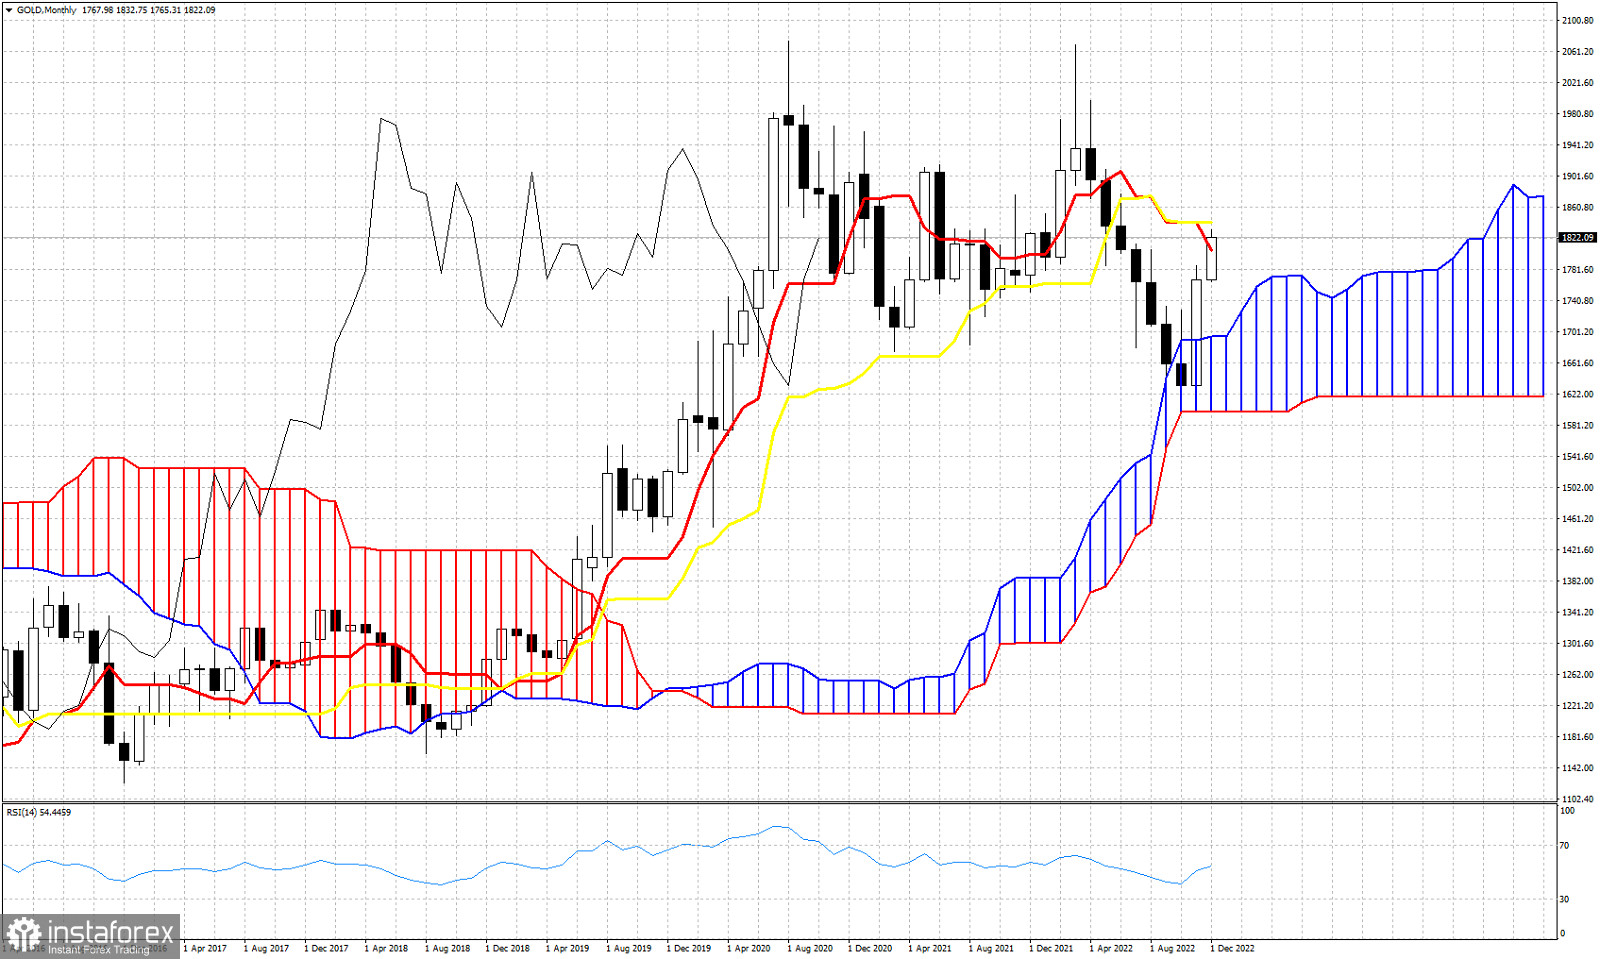
As we approach the end of December and the end of 2022, we take a look what has Gold managed to do over the past months and what the Ichimoku cloud indicator tells us. Gold has barely made any progress relative to December of 2021 but during the year we saw price make a double top at $2,069 and turn lower towards the cloud support. The monthly Kumo (cloud) has been respected as price tested it in September - October and has bounced off of it since then. Price is now challenging the tenkan-sen (red line indicator) and the kijun-sen (yellow line indicator). Both these indicators provide us with a resistance area between $1,805 and $1,842. This is a major resistance area. Support by the upper cloud boundary is at $1,700 and as long as price is above this level, trend remains bullish. A rejection at the resistance area we are currently in could lead to a pull back towards the cloud support. Bulls need to be cautious.
 English
 Русский
 Bahasa Indonesia
 Bahasa Malay
 ไทย
ไทย Español
 Deutsch
 Български
 Français
 Tiếng Việt
 中文
中文 বাংলা
বাংলা हिन्दी
 Čeština
 Українська
 Română

