Today's article on the USD/CAD currency pair will be mainly devoted to the technical analysis of this very interesting trading instrument. Today is the last day of monthly trading, and the market will close in March. Since monthly trading has not been closed yet, we will summarize their results in the next review of this currency pair. In the meantime, I consider it necessary to consider the weekly and daily price charts.
Weekly

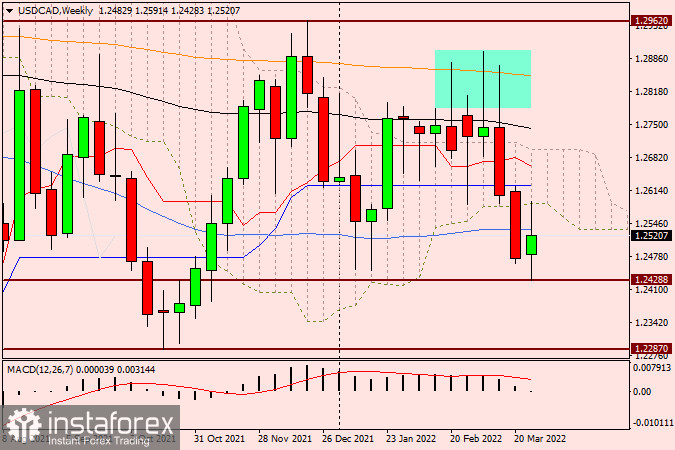
So, following the results of weekly trading, the USD/CAD pair demonstrated a downward trend, as a result of which the Ichimoku indicator was released from the cloud. Technically, this is quite an important point, since the exit of the price from the Ichimoku cloud to one of the sides often indicates a further direction. Often, a rollback occurs to one of the broken boundaries of the Ichimoku cloud, after which the quote turns towards the breakdown. As we can see, in our case, such a pullback took place, after which the bullish candle began to gradually deflate, and at the time of writing this article, it already has a fairly decent upper shadow. However, far from everything is clear, since tomorrow reports will arrive from the United States on the labor market, which will put everything in its place.
According to the technical picture, I draw attention to the fact that the pair's attempts to return to the limits of the Ichimoku indicator cloud may be placed by the blue Kijun line, which runs at 1.2624. But even if the course passes above Kijun, it will collide with the Tenkan red line at 1.2663. I believe that both of these lines are capable of providing strong resistance to the price and throwing it down again from the weekly cloud. The nearest support is represented by the current lows at 1.2428, which, if market participants are disappointed with the American labor reports, can be rewritten. In my personal opinion, the most relevant is the downward scenario for USD/CAD. As can be seen, in the selected zone, there are long upper shadows of several weekly candles at once, which demonstrate the inability of bulls to move the course up on the instrument.
Daily

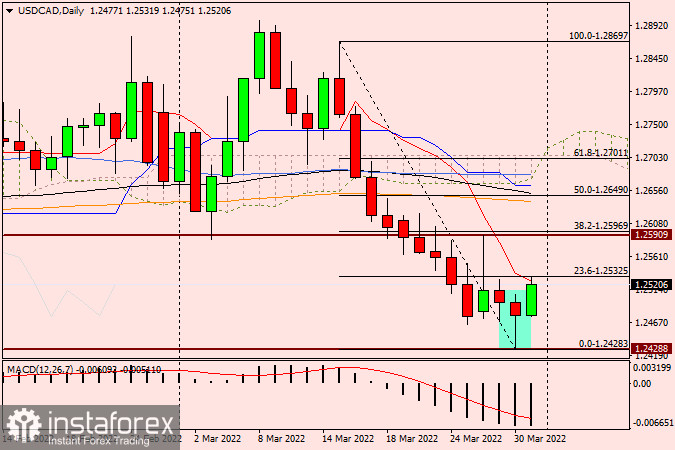
But on the daily chart of the pair, yesterday's candle with a long lower shadow gives a signal about the current completion of the downward dynamics and the beginning of the correction of the piece. In principle, this is already happening. According to the stretched grid of the Fibonacci instrument for a decrease of 1.2869-1.2428, the pair has already rolled back to the first level from this movement of 23.6 Fibo, where it also encountered the red Tenkan line, which together with the Fibo level is trying to resist the quote in its desire to continue the rise. If today's trading closes above the Tenkan and the 23.6 Fibo level, likely, the pair will once again try to test the strong resistance of sellers, which is on the way to the 26th figure, for a breakdown.
As you can see, on March 28 from 1.2590 there was a very strong bounce down and an impressive upper shadow formed at the candle. This factor, and not only it alone, is more likely to wait for the end of the corrective rebound, after which to open transactions for the sale of USD/CAD. The most immediate, aggressive, and risky sales can be considered from the level of 1.2535. We are looking for sales at more favorable prices higher, from the price zone 1.2545-1.2580. The signal to enter the market will be bearish candlestick patterns at smaller time intervals. However, it is necessary to remember tomorrow's data on the US labor market, which may make significant changes to the current forecast.
 English
 Русский
 Bahasa Indonesia
 Bahasa Malay
 ไทย
ไทย Español
 Deutsch
 Български
 Français
 Tiếng Việt
 中文
中文 বাংলা
বাংলা हिन्दी
 Čeština
 Українська
 Română

