Analysis of transactions of the environment:
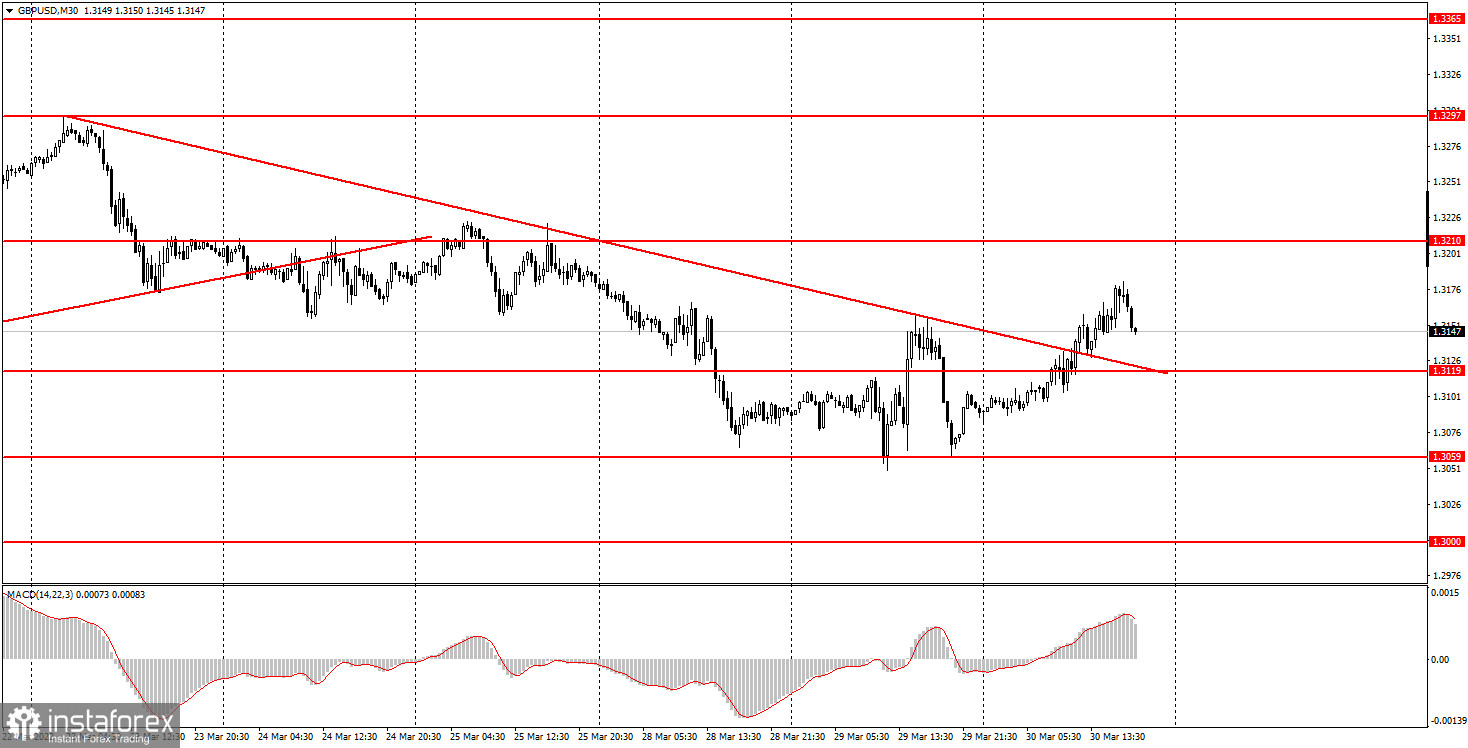
30M chart of the GBP/USD pair.

The GBP/USD pair started a new ascent on Wednesday and overcame the downward trend line. Thus, the bulls' intentions were confirmed on Wednesday, but the prospects for the British pound remain vague. We remind you that yesterday's and today's growth (which, by the way, was not so strong) was provoked by the increased likelihood of a peace agreement between Ukraine and the Russian Federation after negotiations in Turkey. But today it became clear that the signing of the agreement is still very far away. There is still too much to discuss, and neither Moscow nor Kyiv knows how to resolve the issue with Crimea and Donbas. More precisely, they know, but the positions on the disputed territories are radically different from each other. Therefore, the peace agreement is still only a fantasy, not a reality. In total, the British pound managed to grow by 120 points over these two days, but what are 120 points for the pound? This is very little. Thus, despite overcoming the trend line, we believe that the pair's decline may resume in the near future. Support levels can be used as reference lines. If the price bounces off them, then the pound may continue to grow for some time.
5M chart of the GBP/USD pair.
Five trading signals were generated in the 5-minute timeframe on Wednesday. Some of them are false, so you should have traded carefully. The first sell signal at the rebound from the level of 1.3126 turned out to be false. The price was able to go down only 14 points, which was not enough to set a Stop Loss at breakeven. The next buy signal was formed when the level of 1.3126 was overcome and it was possible to earn about 10 points of profit on it. A rebound from the level of 1.3156 is a sale transaction that closed at breakeven, as the price could not work out to the nearest target level, but it still went down 20 points. The next buy signal about overcoming the level of 1.3156 also turned out to be false, and the price could not go 20 points up after its formation. However, this deal could be closed at breakeven manually later in the evening. The last signal was formed too late to work it out. As a result, today novice traders could open three deals, one of which is profitable, one is unprofitable, and the third is at breakeven.
How to trade on Thursday:
On the 30-minute TF, the pair has reversed the downward trend, so in the next few days, the pound may make new attempts to grow. Especially if the geopolitical news continues to speak in favor of de-escalation of the military conflict in Ukraine. Nevertheless, we do not expect strong and long-term growth of the British currency yet. On the 5-minute TF tomorrow, it is recommended to trade by levels 1.3000, 1.3042, 1.3126, 1.3156, 1.3210. When the price passes after the opening of the transaction in the right direction, 20 points should be set to Stop Loss at breakeven. We also pay attention to the new levels on the 30-minute TF 1.3059 and 1.3119. The publication of the fourth-quarter GDP report in the final estimate is scheduled for tomorrow in the UK. It is unlikely that this assessment will be very different from the previous ones, which means that the market reaction is unlikely to follow. There will also be no significant publications and events in America, so geopolitics on Thursday will remain in the first place in terms of importance.
Basic rules of the trading system:
1) The strength of the signal is calculated by the time it took to generate the signal (rebound or overcoming the level). The less time it took, the stronger the signal.
2) If two or more trades were opened near a certain level on false signals, then all subsequent signals from this level should be ignored.
3) In a flat, any pair can form a lot of false signals or not form them at all. But in any case, at the first signs of a flat, it is better to stop trading.
4) Trade transactions are opened in the period between the beginning of the European session and the middle of the American session when all transactions must be closed manually.
5) On a 30-minute TF, signals from the MACD indicator can be traded only if there is good volatility and a trend, which is confirmed by a trend line or a trend channel.
6) If two levels are located too close to each other (from 5 to 15 points), then they should be considered as a support or resistance area.
What's on the chart:
Price support and resistance levels - target levels when opening purchases or sales. Take Profit levels can be placed near them.
Red lines - channels or trend lines that display the current trend and show in which direction it is preferable to trade now.
MACD indicator (14, 22, 3) is a histogram and a signal line - an auxiliary indicator that can also be used as a signal source.
Important speeches and reports (always contained in the news calendar) can greatly influence the movement of a currency pair. Therefore, during their exit, it is recommended to trade as carefully as possible or exit the market to avoid a sharp price reversal against the previous movement.
Forex beginners should remember that every trade cannot be profitable. The development of a clear strategy and money management are the keys to success in trading over a long period.
 English
 Русский
 Bahasa Indonesia
 Bahasa Malay
 ไทย
ไทย Español
 Deutsch
 Български
 Français
 Tiếng Việt
 中文
中文 বাংলা
বাংলা हिन्दी
 Čeština
 Українська
 Română

