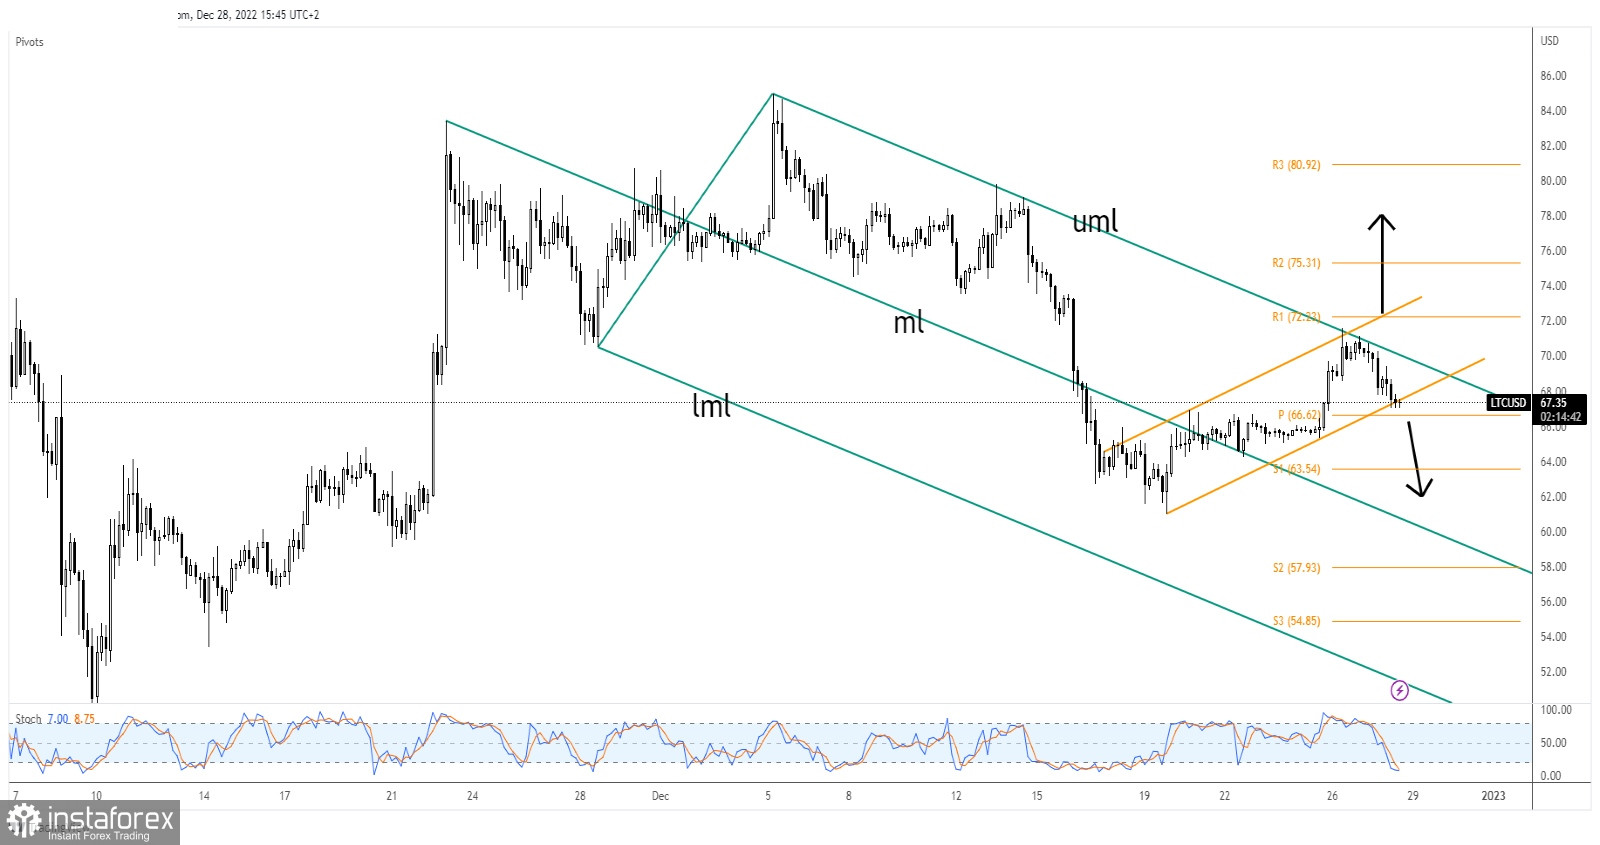
The LTC/USD slipped lower in the short term after reaching the 71.60 high. The altcoin dropped as the price of Bitcoin turned to the downside after its temporary rebound. Litecoin developed a bearish pattern, but we still need confirmation.
Litecoin registered a 6.38% drop from Monday's high of 71.60 to 67.03 level. It remains to see what will happen, as the sellers could be exhausted around the near-term support levels.
LTC/USD challenges support

LTC/USD tested and retested the upper median line (uml), and now it challenges the uptrend line. This represented dynamic support, while the weekly pivot point of 66.62 is seen as static support.
As long as it stays under the upper median line (uml), the LTC/USD could develop a new leg down. Technically, the channel may represent a downside formation.
LTC/USD forecast
A valid breakdown below the weekly pivot point of 66.62 could announce more declines toward the S1 (63.54). As long as it stays below the upper median line (uml), the price could be attracted by the median line (ml).
 English
 Русский
 Bahasa Indonesia
 Bahasa Malay
 ไทย
ไทย Español
 Deutsch
 Български
 Français
 Tiếng Việt
 中文
中文 বাংলা
বাংলা हिन्दी
 Čeština
 Українська
 Română

