EUR/USD
Analysis:
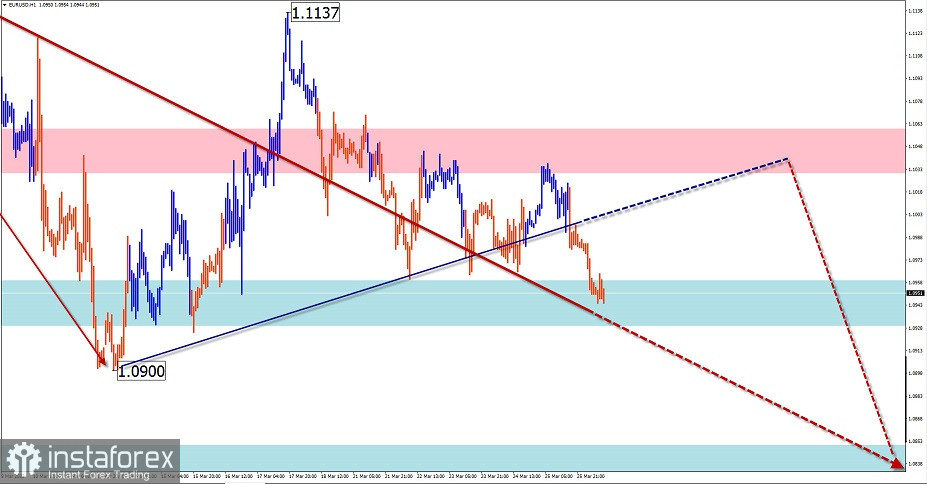
The daily chart shows the downtrend of the European currency major over the last year and a half. The incomplete section started on March 9 this year. Analysis of the structure of this wave shows the absence of the final part (C).
Forecast:
In the nearest trading sessions, we can expect a flat movement, mainly sideways. Short-term price growth is possible, not higher than the estimated resistance. At the end of the day, trading activity is likely to increase, with the resumption of the downward movement. In case the lower border of the nearest support is breached, the decline will continue to the next zone.
Potential reversal zones
Resistance:
- 1.1030/1.1060
Support:
- 1.0960/1.0930
- 1.0850/1.0820
Recommendations:
There are no buying conditions in the euro market today. It is recommended to refrain from trading the pair until there are confirmed sell signals.

USD/JPY
Analysis:
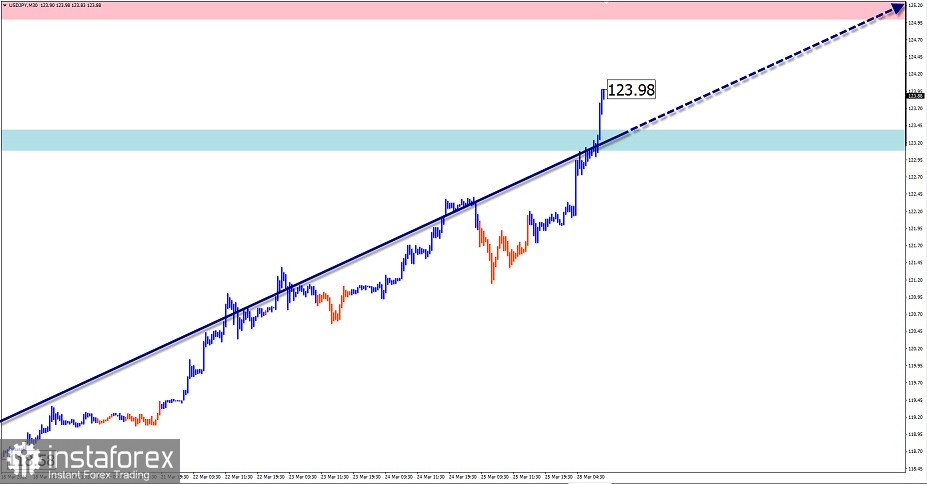
The Japanese yen has been weakening rapidly against the US dollar since the beginning of this year. The ascending impulse wave brings the price closer to the lower border of the preliminary target zone. The structure of the wave looks complete, but there are no signals of an imminent reversal.
Outlook:
A continuation of the general upward movement of the pair's exchange rate is expected today. Short-term stops in the form of sideways sections are possible during the day.
Potential reversal zones
Resistance:
- 125.00/125.30
Support:
- 123.40/123.10
Recommendations:
There are no conditions to open short positions in the yen today. It is recommended to watch for buying signals at the end of all counter-movements.

GBP/JPY
Analysis:
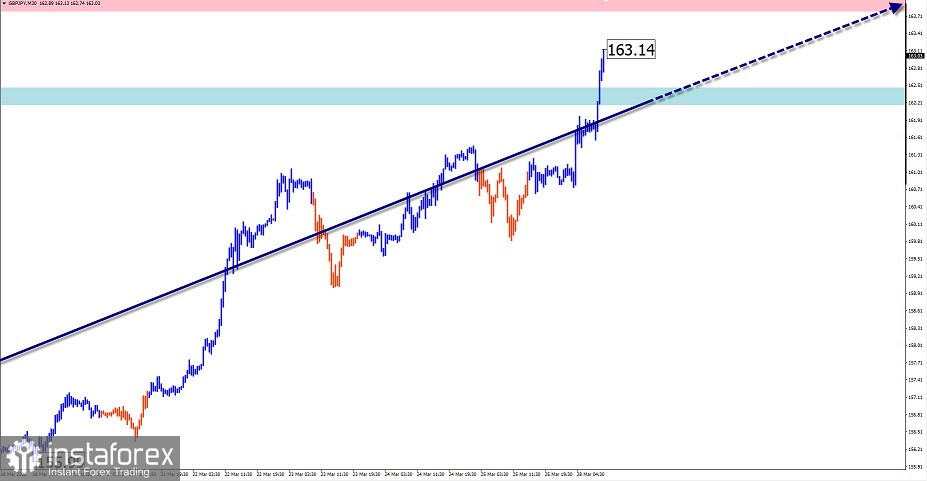
The trend direction of the English Pound/Japanese Yen cross over the last two years is set by an ascending wave algorithm. The incomplete section traces back to March 8. The price movement has a clear impulsive nature. By now the price has sold the level of the intermediate resistance zone.
Outlook:
In the near future, the general upward movement vector is expected to continue. On the forthcoming session short-term flat is possible along the support zone. The highest activity is likely at the end of the day, or tomorrow.
Potential reversal zones
Resistance:
- 163.80/164.10
Support:
- 162.50/162.20
Recommendations:
In the cross market today, we recommend to look for signals at the end of all counter-movements to buy the instrument.

GOLD
Analysis:
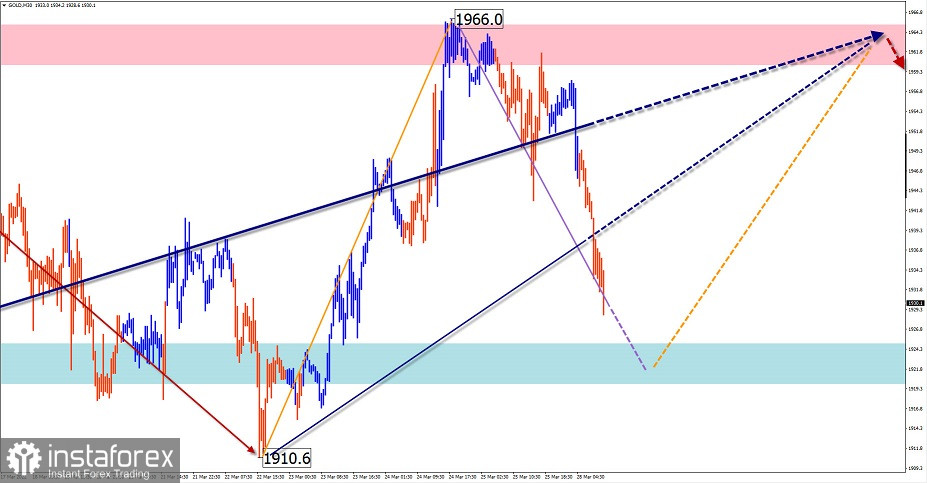
The downward wave from March 8 is setting the main direction for gold's price swings. An intermediate correction has been forming in the last 2 weeks. The structure of this move is not complete.
Outlook:
In the current day, the end of the downward movement, the formation near the support zone of the reversal and the resumption of price growth can be expected. A breakout beyond the boundaries of estimated resistance is unlikely.
Potential reversal zones
Resistance:
- 1960.0/1965.0
Support:
- 1925.0/1920.0
Recommendations:
Trading in the gold market today is risky and could lead to losses. Short-term buying with fractional lots will be possible after reversal signals appear in the support area.

Explanation: In simplified wave analysis (SVA), waves consist of 3 parts (A-B-C). The last unfinished wave is analysed. The solid arrow background shows the structure formed. The dotted arrow shows the expected movements.
Attention: The wave algorithm does not take into account the duration of the instrument movements over time!
 English
 Русский
 Bahasa Indonesia
 Bahasa Malay
 ไทย
ไทย Español
 Deutsch
 Български
 Français
 Tiếng Việt
 中文
中文 বাংলা
বাংলা हिन्दी
 Čeština
 Українська
 Română

