When to go long on GBP/USD:
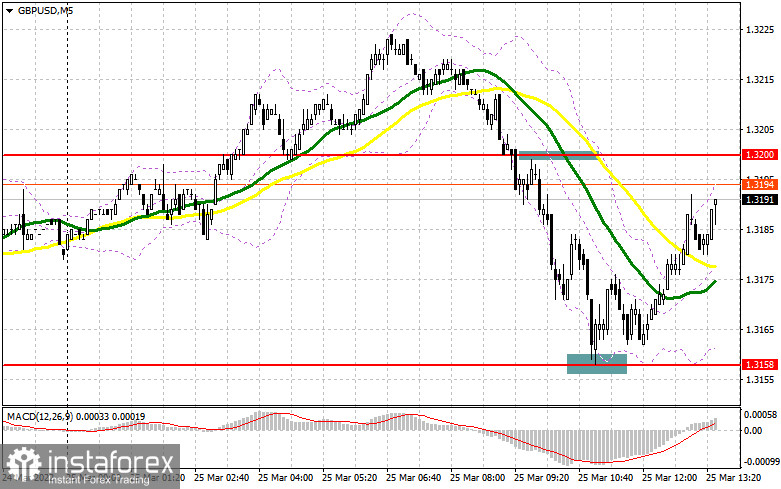
In my morning review, I paid attention to levels 1.3200 and 1.3158 and said you should consider entering the market from there. Let's now turn to the 5-minute chart and try to figure out what happened. A fall of the pound after disappointing retail sales data in the UK and a retest of the mark bottom-top produced a sell signal. The pair went down by 40 pips to support at 1.3158. A false breakout there generated a buy signal, and the price rose by 30 pips. Technically, nothing has changed, and the trading strategy is still the same.

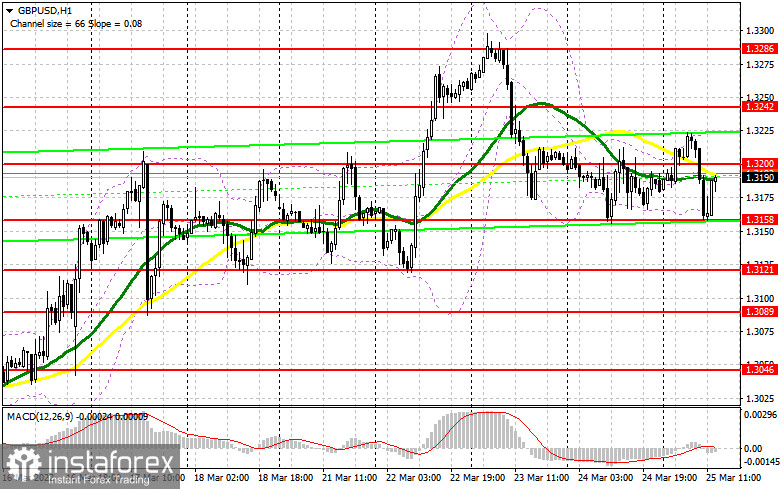
A plunge in UK retail sales became a major contributor to a fall in the pound in the first half of the day. Although for the Bank of England this is definitely good news as they can forget about rising inflation for a moment. Geopolitical developments are again in the view. Today, Russia's Press Secretary Dmitry Peskov said it is too early to talk about the future of peace talks as the reality has changed and a serious reassessment of the current situation is needed. It is unclear what he has meant by that. Macro reports scheduled for release in the US in the second half of the day are highly unlikely to cause a burst of volatility. Therefore, the levels highlighted in the morning are still relevant. Thus, to extend gains, bulls need to regain control over the 1.3200 level. A breakout, consolidation, and a retest of the mark top-bottom will produce a buy signal with the target at 1.3242. The pair will be able to go above the barrier only in the case of a positive fundamental background and increased demand for risky assets, which is unlikely to happen during the North American session. A breakout and a test of the 1.3242 mark will make a buy signal, allowing bulls to approach the area of the 1.3286 and 1.3340 highs. A more distant target stands at 1.3390, where taking a profit should be considered. However, the pair will be able to test it if only some breakthrough is achieved in peace talks between Russia and Ukraine. In the event of bearish GBP/USD during the North American session and a decrease in bullish activity at 1.3200, you may go long when the price has reached support at 1.3158 and a false breakout has occurred. Long positions on GBP/USD could also be entered on a rebound from 1.3121 or the 1.3089 low, allowing a 30-35 pips correction intraday.
When to go short on GBP/USD:
Bears have reached the target set in the morning and everything now depends on their behavior at the resistance level of 1.3200. It is highly unlikely to be tested in the second half of the day as bulls will try to regain control over the market and extend gains. In the case of a false breakout at 1.3200, the pair may fall to support at 1.3158. A false breakout and a retest of the mark bottom-top will produce an additional sell signal, with targets at the 1.3121 and 1.3089 lows, where you should consider taking a profit. The 1.3046 level serves as a more distant target. In the event of bullish GBP/USD in the second half of the day and a decrease in bearish activity at 1.3200, you could go short when the price reaches resistance at 1.3242, and only if there is a false breakout. Short positions on GBP/USD could be entered on a rebound from 1.3286 or the 1.3340 high, allowing a 20-25 pips correction intraday.

Commitments of Traders:
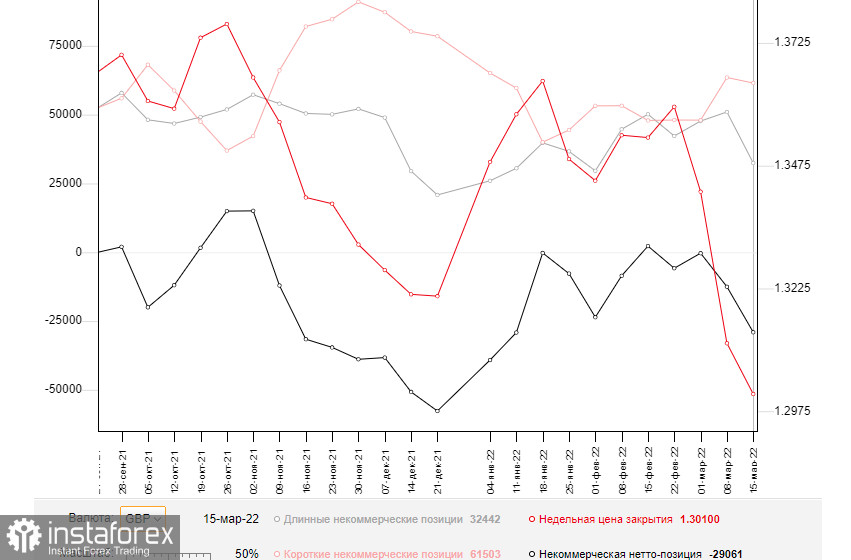
The COT report for March 15 logged a sharp drop in long positions and only small changes in short ones. The results of the BoE meeting avidly affected the British currency. Despite the expected increase in the interest rate, the regulator did not hint at a further tightening of monetary policy. It decided to stick to more dovish rhetoric despite soaring inflation that already reached all-time highs. Falling household income and the worsening standard of living are weighing on the regulator. The regulator is hesitant to take more aggressive measures because of the current geopolitical situation. A more aggressive tightening may harm the economy rather than help it. The regulator needs to find measures to cap rising inflation, avoiding potentially harmful decisions. Many analysts believe that inflation may climb higher in spring. Therefore, traders are in no hurry to buy the pound sterling. Besides, it is losing momentum against the US dollar. The FOMC meeting was in the limelight last week. The watchdog raised the interest rate by 0.25%. This decision did not stir up volatility as many traders had already priced it in. To this end, it is recommended to open long positions on the US dollar as the bearish trend on the GBP/USD pair persists. The only thing that may halt a sell-off of the pound sterling is high inflation. It will eventually force the Bank of England to take a hawkish stance. The COT report for March 15 revealed that the number of long non-profit positions declined to 32,442 from 50,982, while the number of short non-profit positions dropped to 61,503 from 63,508. It increased in the negative delta of the non-commercial net position to -29,061 from -12,526. The weekly closing price dropped to 1.3010 against 1.3113.

Indicator signals:
Moving averages
Trading is carried out in the area of the 30-day and 50-day moving averages, indicating a sideways market.
Note: The period and prices of moving averages are viewed by the author on the hourly chart and differ from the general definition of classic daily moving averages on the daily chart.
Bollinger Bands
The lower band at 1.3160 stands as support. Resistance is seen at 1.3230 in line with the upper band.
Indicator description:
- Moving average (MA) determines the current trend by smoothing volatility and noise. Period 50. Colored yellow on the chart.
- Moving average (MA) determines the current trend by smoothing volatility and noise. Period 30. Colored green on the chart.
- Moving Average Convergence/Divergence (MACD). Fast EMA 12. Slow EMA 26. SMA 9.
- Bollinger Bands. Period 20
- Non-commercial traders are speculators such as individual traders, hedge funds, and large institutions who use the futures market for speculative purposes and meet certain requirements.
- Long non-commercial positions are the total long position of non-commercial traders.
- Non-commercial short positions are the total short position of non-commercial traders.
- Total non-commercial net position is the difference between short and long positions of non-commercial traders.
 English
 Русский
 Bahasa Indonesia
 Bahasa Malay
 ไทย
ไทย Español
 Deutsch
 Български
 Français
 Tiếng Việt
 中文
中文 বাংলা
বাংলা हिन्दी
 Čeština
 Українська
 Română

