Technical Market Outlook:
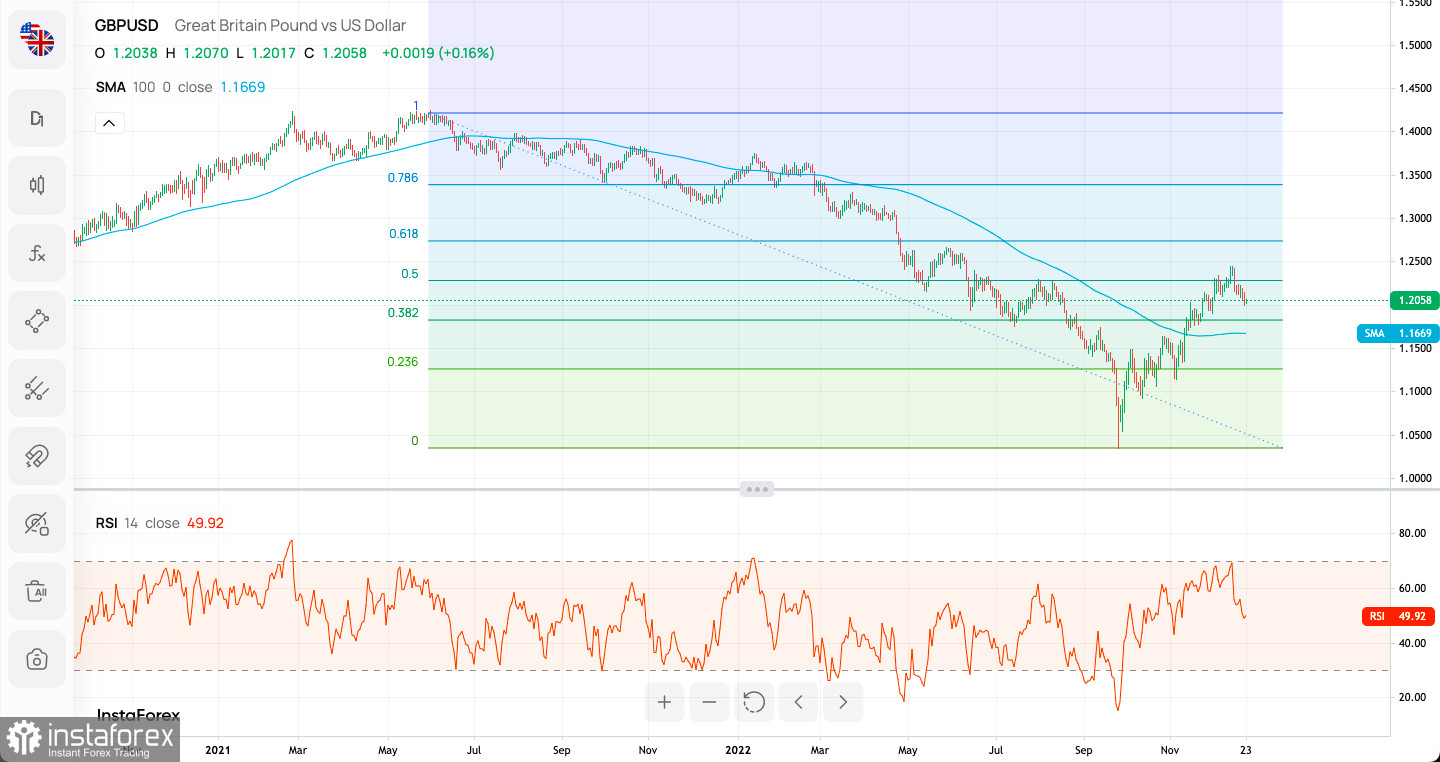
The GBP/USD pair has made Double Top price pattern at the weekly high seen at the level of 1.2444, retraced just little over 50% of the last wave down and then reversed sharply below the level of 1.2286. The market used to trade inside a narrow horizontal zone located between the levels of 1.2106 - 1.2208 as the wave B has been developing, however, just recently bears made a new local low at the level of 1.2054. The intraday technical resistance is seen at the level of 1.2240, which is just above the trend line resistance. Any violation of this level would indicate the development of the wave C to the downside. Please notice the neutral momentum on the daily time frame chart.

Weekly Pivot Points:
WR3 - 1.22750
WR2 - 1.22266
WR1 - 1.22032
Weekly Pivot - 1.21782
WS1 - 1.21548
WS2 - 1.21298
WS3 - 1.20814
Trading Outlook:
The bulls are temporary in control of the market and the 50% Fibonacci retracement of the last big wave down located at 1.2293 had been broken, so the next target is 61% Fibonacci retracement level (1.2760). On the other hand, the level of 1.0351 has not been tested since 1985, so the down trend is strong. In order to terminate the down trend, bulls need to close the weekly candle above the level of 1.2275 (swing high from August 10th).
 English
 Русский
 Bahasa Indonesia
 Bahasa Malay
 ไทย
ไทย Español
 Deutsch
 Български
 Français
 Tiếng Việt
 中文
中文 বাংলা
বাংলা हिन्दी
 Čeština
 Українська
 Română

