When to go long on GBP/USD:
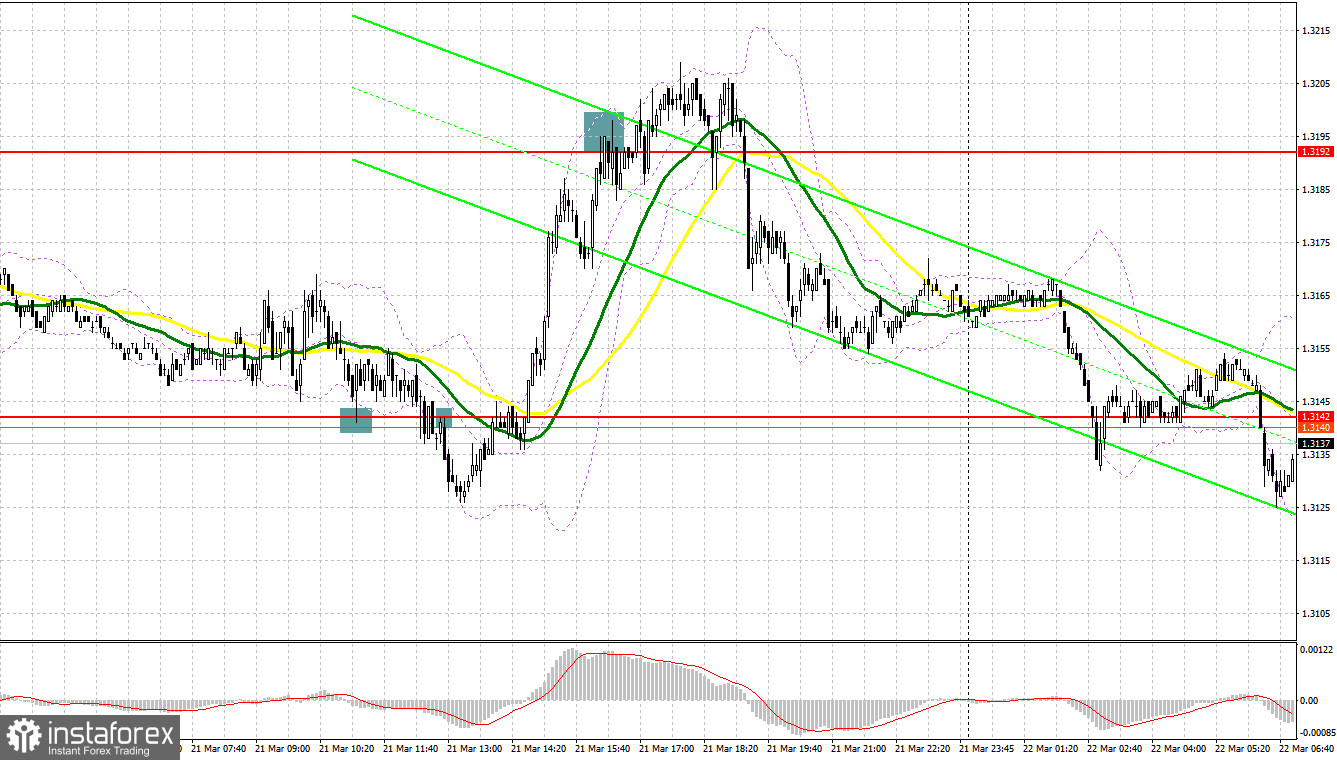
Several entry points were made yesterday. Let's turn to the M5 chart to analyze the situation. When making my previous analysis, I paid attention to the 1.3142 level and said you should consider entering the market from there. A fall of the pound to 1.3142 and a false breakout there produced a buy entry point. However, bullish bias was not supported by major market players. Therefore, having increased by 10 pips, the pair came under pressure. A sell signal was generated after a breakout of support and its retest bottom-top. The price then fell by 17 pips and a reversal emerged. I received no strong buy signal at 1.3142 and had to refrain from going long. A false breakout at 1.3192 was also unprofitable as the market was unable to reverse quickly.

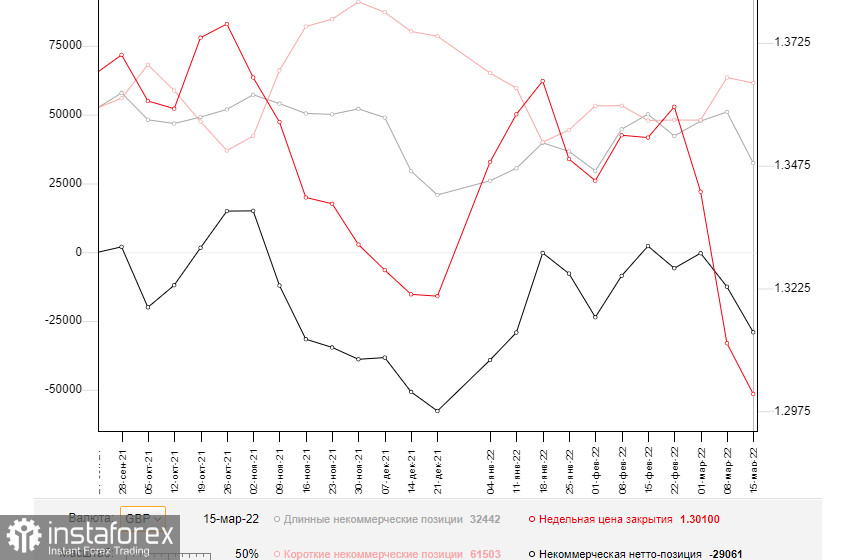
Before analyzing the technical picture, let's see what has happened in the futures market. The Commitments of Traders report for March 15 logged a steep fall in the number of longs and a slight change in the number of shorts. The BoE's meeting has had a harmful effect on the pound. In spite of the expected rate hike, the regulator showed no signs of taking a more aggressive stance on monetary policy. It chose to stay dovish despite the record inflation rate in the United Kingdom. Although the British are clearly dissatisfied with the current state of affairs, aggressive actions could be harmful to the economy. The central bank is now thinking about how to cause less harm to it as the fight against rising inflation has just begun. In this light, traders are hesitant to invest in the British pound, which is getting weaker versus the US dollar. Likewise, the FOMC meeting was at the center of attention last week. The Committee raised the interest rate by 25 basis points. However, it did not cause turbulence in the market as traders had expected such a decision. In this light, it is wiser to buy the dollar, while GBP/USD is still bearish. High inflation in the UK is the only reason why the pound hasn't been sold off yet. The COT report for March 15 revealed a decrease in long non-commercial positions to 32,442 versus 50,982 and a drop in short non-commercial positions to 61,503 from 63,508. The total weekly non-commercial net position increased to -29,061 versus -12,256. The weekly closing price fell to 1.3010 from 1.3113.

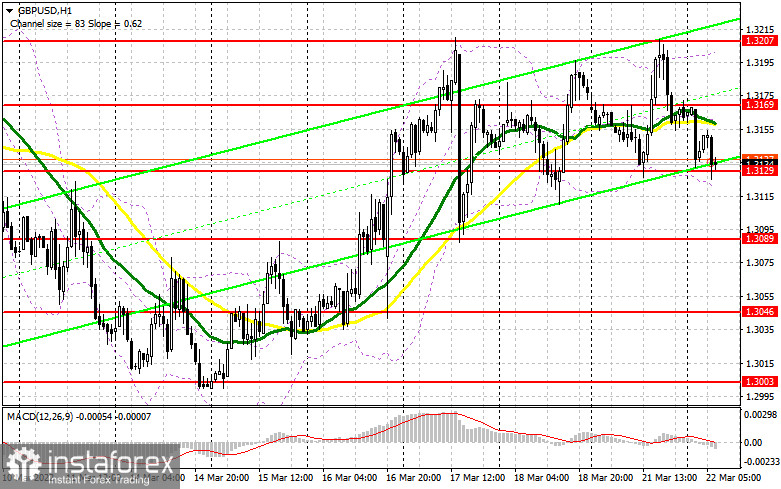
Pressure on the pair is likely to continue building up. An increase in the number of short positions came after Fed Chair Powell's hawkish statement yesterday. Powell hinted at the possibility of a 0.5% rate hike at the next meeting. Those willing to buy the pound today should be cautious. Bulls will try to protect support at 1.3129, which has recently been tested several times. This level seems to be of no importance to bulls because if the pound returns in the range, bullish activity is unlikely to increase anyway. In the event of a false breakout at 1.3129 and positive data on the UK public sector net borrowing, a buy signal will be made. If so, GBP/USD may retrace up. In such a case, bulls will drive the pair to 1.3169, the middle of the sideways channel. The price failed to settle above it yesterday. A breakout and a test of this level top-bottom will produce an additional entry point, with targets at the 1.3207 high and new resistance at 1.3244. The level of 1.3275 stands as a more distant target where you should consider taking a profit. However, the price will be able to go there in case of positive news on the Russia-Ukraine conflict. In the event of a fall during the European session and a decrease in bullish activity at 1.3129, which is highly likely, you could go long when the price has reached support at 1.3089 or 1.3046. The bearish trend will extend and the quote will rebound only in case of a false breakout there. Long positions on GBP/USD could also be entered on a rebound from 1.3003, allowing a 30-35 pips correction intraday.
When to go short on GBP/USD:
GBP/USD still trades in the bearish trend. The trend will get deeper if geopolitical tensions escalate. However, if the situation improves, bears will instantly leave the market. This will trigger a steep rise in the pound. The pair trades below the MAs, which confirms the bearish market. Sellers will try to protect the 1.3169 level. A false breakout there will produce a sell entry point, with the target at 1.3129, in line with the lower limit of the sideways channel. A breakout and a retest of this range bottom-top will trigger a row of stop orders, and GBP/USD will plunge to the lows at 1.3089 and 1.3046. The 1.3003 mark stands as another target where you should consider taking a profit. In the event of a rise in the first half of the day and a decrease in bearish activity at 1.3169, you could go short when the price reaches the upper limit of the sideways channel at 1.3207 and only if there is a false breakout. Short positions on GBP/USD could be entered on a pullback from 1.3275 or the 1.3244 high or 1.3275, allowing a 30-35 pips correction intraday.

Indicator signals:
Moving averages
Trading is carried out below the 30-day and 50-day moving averages, indicating a bearish market.
Note: The period and prices of moving averages are viewed by the author on the hourly chart and differ from the general definition of classic daily moving averages on the daily chart.
Bollinger Bands
The lower band at 1.3120 stands as support. Resistance is seen at 1.3210 in line with the upper band.
Indicator description:
- Moving average (MA) determines the current trend by smoothing volatility and noise. Period 50. Colored yellow on the chart.
- Moving average (MA) determines the current trend by smoothing volatility and noise. Period 30. Colored green on the chart.
- Moving Average Convergence/Divergence (MACD). Fast EMA 12. Slow EMA 26. SMA 9.
- Bollinger Bands. Period 20
- Non-commercial traders are speculators such as individual traders, hedge funds, and large institutions who use the futures market for speculative purposes and meet certain requirements.
- Long non-commercial positions are the total long position of non-commercial traders.
- Non-commercial short positions are the total short position of non-commercial traders.
- Total non-commercial net position is the difference between short and long positions of non-commercial traders.
 English
 Русский
 Bahasa Indonesia
 Bahasa Malay
 ไทย
ไทย Español
 Deutsch
 Български
 Français
 Tiếng Việt
 中文
中文 বাংলা
বাংলা हिन्दी
 Čeština
 Українська
 Română

