Analysis of Monday's deals:
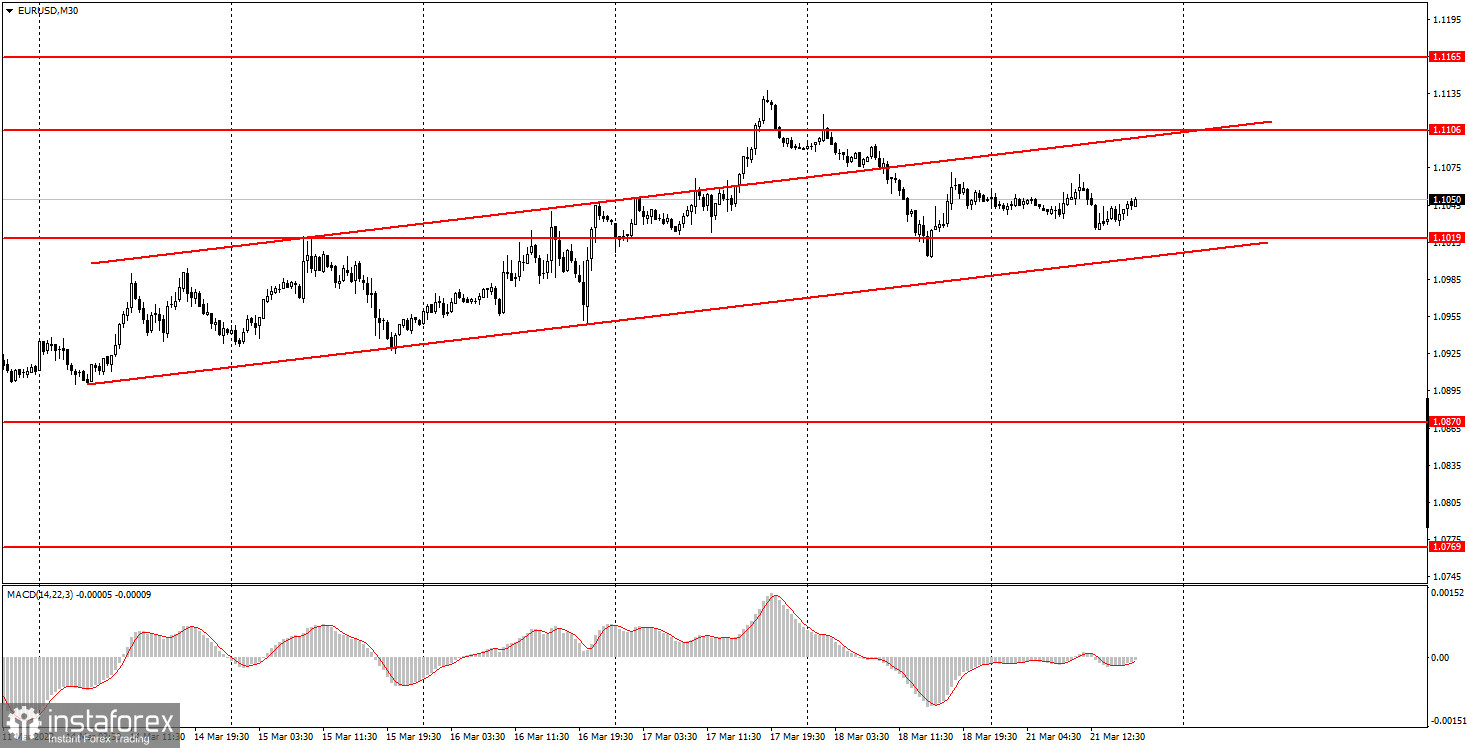
30M chart of the EUR/USD pair.

The EUR/USD currency pair was trading on Monday in its best traditions of a month ago. Namely, with minimal volatility and strictly sideways. The volatility of the day was slightly more than 40 points. At the same time, the upward trend, which we consider weak, has nevertheless persisted, so theoretically the pair can continue its upward movement this week. But if there is a consolidation below the channel, the European currency may rush down again. According to the overwhelming majority of experts, the European currency is still at risk and may resume falling against the background of the geopolitical factor at any moment. ECB President Christine Lagarde delivered a speech in the European Union today, and Fed Chairman Jerome Powell delivered a speech in the United States. Novice traders can see how important these events were for the market by the reaction of the market to them. And this very reaction simply did not exist. Both functionaries talked about inflation, trying to charge the markets with positivity. But the markets are already tired of empty promises, especially for Christine Lagarde. There were no macroeconomic statistics today.
5M chart of the EUR/USD pair.
There were no trading signals on the 5-minute timeframe during Monday. At the end of the European trading session, the price came close to the level of 1.1019, but still did not work out and did not form a buy signal. We believe that this is for the best today, as volatility has been weak all day, so it was still quite difficult to count on any. The level of 1.1070 appeared only today - this is the maximum of the day, so it did not participate in today's trading. In principle, the 5-minute TF clearly shows that the pair has been moving sideways all day, and there were no outbursts of emotions and activity that could have happened if Powell or Lagarde had reported anything important. Thus, the European currency continues to move up with difficulty and with even greater difficulty to keep from falling again. However, we recall that most factors now speak in favor of a new strengthening of the US currency.
How to trade on Tuesday:
A new upward trend has been formed on the 30-minute timeframe, but it may be short-term. Or at least weak. We believe that the euro currency currently has no strong grounds for long-term growth, so the pair's decline may resume in the near future. It will be possible to identify a new fall of the pair by fixing the price below the ascending channel. On the 5-minute TF tomorrow, it is recommended to trade by levels: 1.0932, 1.1003-1.1019, 1.1070, 1.1106, 1.1136. When passing 15 points in the right direction, you should set the Stop Loss to breakeven. Another speech by ECB President Christine Lagarde will take place in the European Union on Tuesday, but traders themselves can see that at this time there should be no reaction to Lagarde's empty statements. Most likely, it will be the same tomorrow. In America, not a single important event or publication is scheduled for Tuesday at all. Thus, weak volatility may be observed again tomorrow. However, do not forget about the geopolitical factor. Although no negotiations are scheduled for tomorrow, the market continues to be in a suspended and excited state.
Basic rules of the trading system:
1) The strength of the signal is calculated by the time it took to generate the signal (rebound or overcoming the level). The less time it took, the stronger the signal.
2) If two or more trades were opened near a certain level on false signals, then all subsequent signals from this level should be ignored.
3) In a flat, any pair can form a lot of false signals or not form them at all. But in any case, at the first signs of a flat, it is better to stop trading.
4) Trade transactions are opened in the period between the beginning of the European session and the middle of the American session when all transactions must be closed manually.
5) On a 30-minute TF, signals from the MACD indicator can be traded only if there is good volatility and a trend, which is confirmed by a trend line or a trend channel.
6) If two levels are located too close to each other (from 5 to 15 points), then they should be considered as a support or resistance area.
What's on the charts:
Price support and resistance levels - target levels when opening purchases or sales. Take Profit levels can be placed near them.
Red lines - channels or trend lines that display the current trend and show in which direction it is preferable to trade now.
MACD indicator (14,22,3) is a histogram and a signal line - an auxiliary indicator that can also be used as a signal source.
Important speeches and reports (always contained in the news calendar) can greatly influence the movement of a currency pair. Therefore, during their exit, it is recommended to trade as carefully as possible or exit the market to avoid a sharp price reversal against the previous movement.
Beginners to trade in the forex market should remember that every transaction cannot be profitable. Developing a clear strategy and money management is the key to success in trading for a long period.
 English
 Русский
 Bahasa Indonesia
 Bahasa Malay
 ไทย
ไทย Español
 Deutsch
 Български
 Français
 Tiếng Việt
 中文
中文 বাংলা
বাংলা हिन्दी
 Čeština
 Українська
 Română

