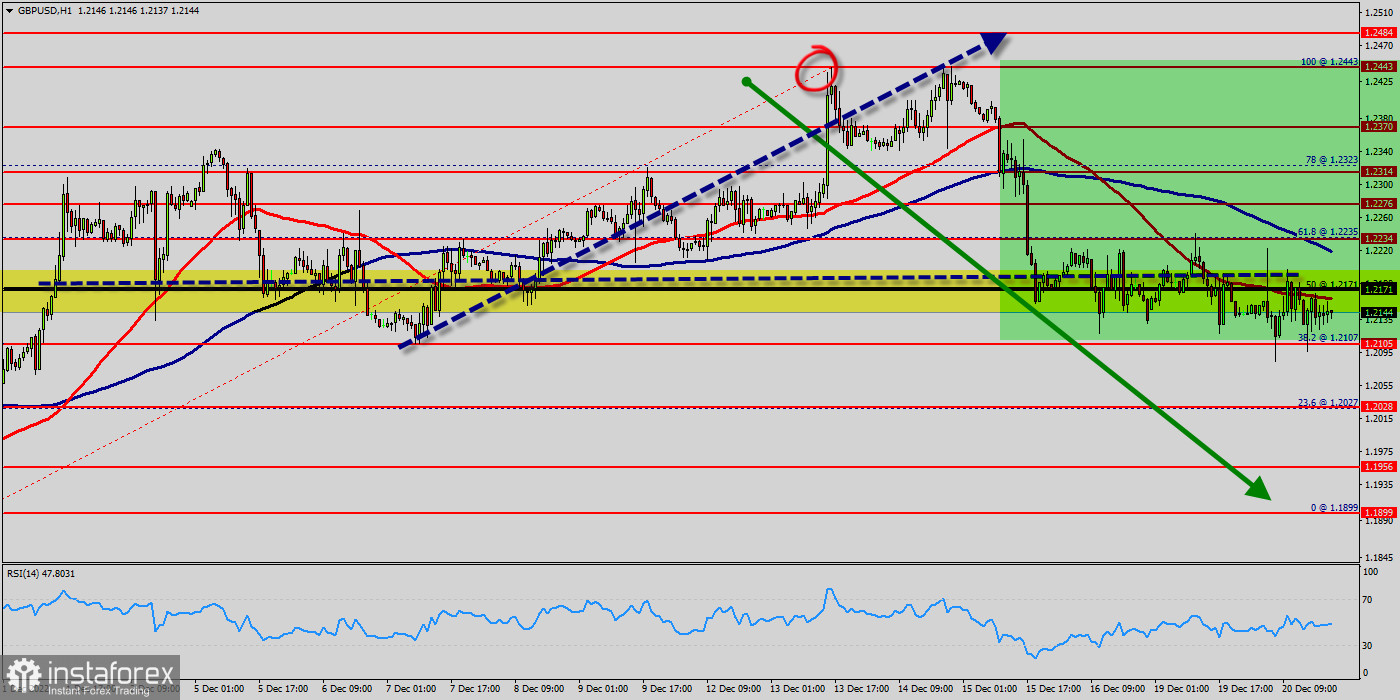
All elements being rather bullish, it would be possible for traders to only trade long positions (at the time of purchase) on GBP/USD as long as the price remains well above 1.2105. A bullish break in this resistance would boost the bullish momentum. The buyers could then target the resistance located at 1.2234. Its reversal would lead to mitigation of the, bullish, basic trend. If you have another key point closer to the current price, it would be better to only trade long positions (at the time of purchase) above that key point.
The GBP/USD pair is at highest against the dollar around the spot of 1.2150 for a day. The GBP/USD pair is inside in upward channel. This week, the GBP/USD pair decreased within an up channel, for that the trend its new highest 1.2171.
But the trend rebounded from the resistance 1.2171 to close at 1.2130 on the hourly chart. Consequently, the first support is set at the level of 1.2105.
Hence, the market is likely to show signs of a bullish trend around the area of 1.2105 and 1.2150.
The GBP/USD pair reverses from 1.2100 and drops to multi-day lows near 1.2105 - this price formed a bottom this morning in the hourly chart. Right now, the GBP/USD pair dropped further and bottomed at 1.2105.
It then trimmed losses, rising to from 1.2105. The move lower took place amid a stronger US dollar across the board. Probably, the main scenario is continued decline towards 1.2171 (sentiment level).
The level of 1.2171 coincides with the golden ratio (50% of Fibonacci retracement) which is acting as major support today.
Another thought: the Relative Strength Index (RSI) is considered overbought because it is above 55. The GBP/USD pair price could be awaiting a major upswing if the digital savings manages to slice above a fatal line of the first resistance that sets at the price of 1.2105 (Horizontal red line).
The prevailing chart pattern suggests that if the leading the trend could be expecting to rebound from the levels of 1.2100 and 1.2105. Moreover, if the GBP/USD pair fails to break through the support prices of 1.2314 1.2105, the market will rise further to 1.2171so as to try to break it again.
The GBP/USD pair is one the best overall investment for in coming weeks. However, if you want to try to improve the growth of Pound, thus it seems great to buy above the last bearish waves of 1.2171. The pair will move upwards continuing the development of the bullish trend to the level 1.2171 - golden ratio 50%.
Buy orders are recommended above the major's support rates of (1.2105) with the first target at the level of 1.2171. Furthermore, if the trend is able to breakout through the first resistance level of 1.2171.
We should see the pair climbing towards the next target of 1.2443. It might be noted that the level of 1.2234 is a good place to take profit because it will form a new double top in coming hours.
Overall, we still prefer the bullish scenario. Consequently, there is a possibility that the GBP/USD pair will move upside. The structure of a rise does not look corrective. In order to indicate a bullish opportunity above 1.2234, re-buy above 1.2234 with the third target at 1.2272.
Besides, the weekly resistance 2 is seen at the level of 1.2272. The market will climb further to 1.2272. This would suggest a bullish market because the RSI indicator is still in a positive area and does not show any trend-reversal signs.
The pair is expected to rise higher towards at least 1.2272 in order to test the third resistance (1.2272) in coming hours.
However, traders should watch for any sign of a bullish rejection that occurs around 1.2100.
 English
 Русский
 Bahasa Indonesia
 Bahasa Malay
 ไทย
ไทย Español
 Deutsch
 Български
 Français
 Tiếng Việt
 中文
中文 বাংলা
বাংলা हिन्दी
 Čeština
 Українська
 Română

