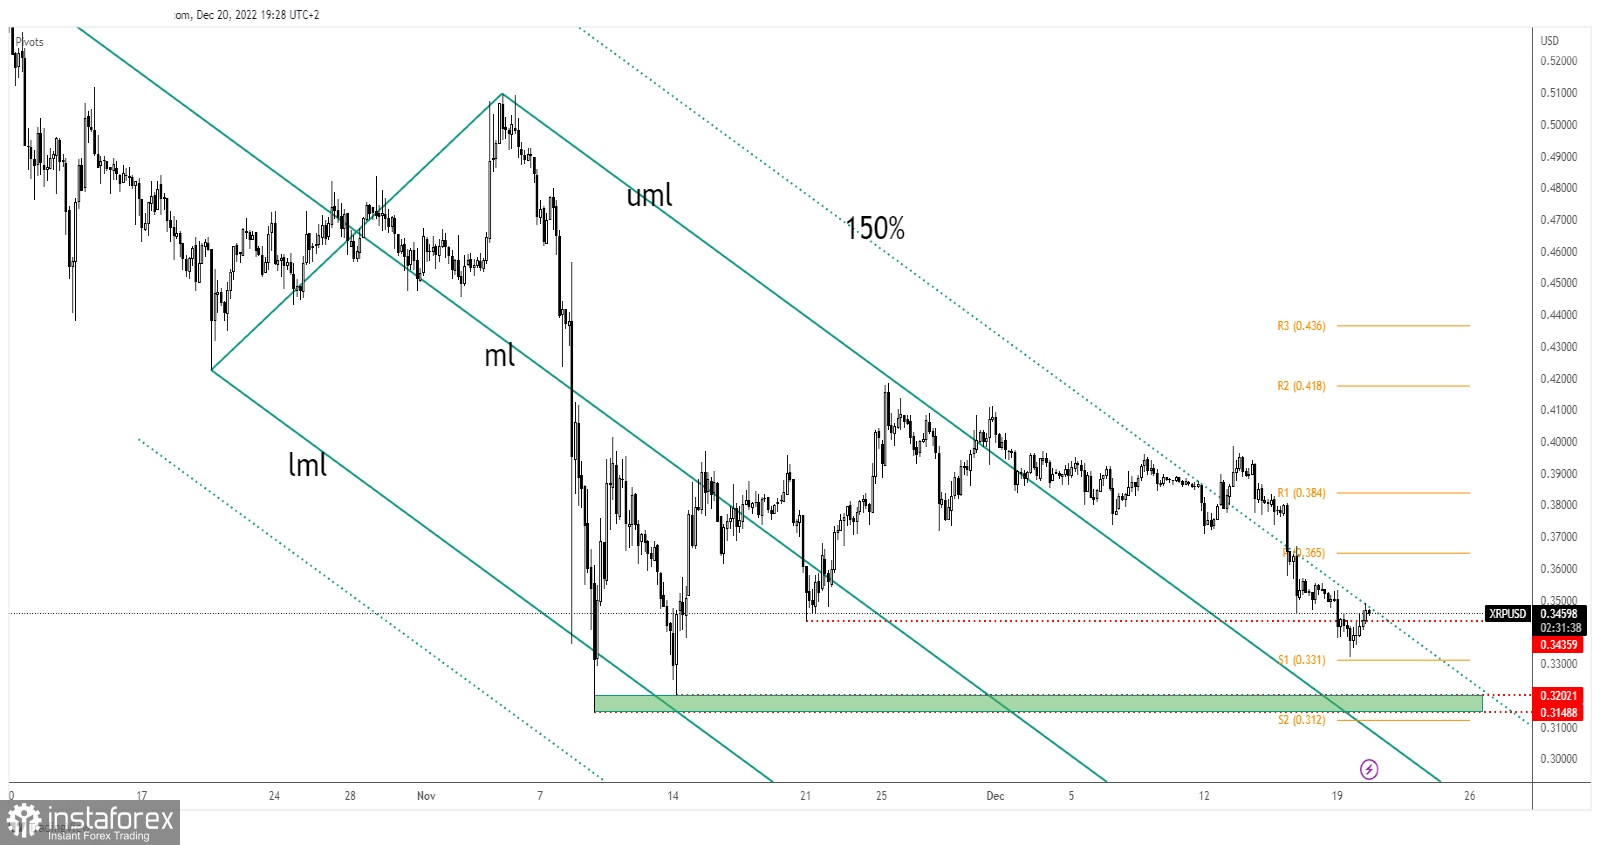
XRP/USD dropped in the short term as the price of Bitcoin dropped as well. As you already know, when BTC/USD drops, the altcoins lose altitude as well. Now, Ripple is trading at 0.3449 at the time of writing above yesterday's low of 0.3321.
In the last 24 hours, Ripple is up by 2.87% but it's down by 11.85% in the last 7 days. The bias remains bearish, that's why we need strong confirmation before going long.
XRP/USD Retests The 150% Fibonacci Line!

XRP/USD dropped again below the 150% Fibonacci line and under 0.3435 static support. The 0.3202 - 0.3148 area represents a major downside obstacle. On the other hand, the 150% Fibonacci line remains a dynamic resistance.
A bullish pattern could announce a new leg higher. Personally, I would like the rate to approach and reach the major demand zone before developing a new swing higher.
XRP/USD Prediction!
A valid breakout through the 150% Fibonacci line and staying above 0.3435 could announce a new swing higher.
 English
 Русский
 Bahasa Indonesia
 Bahasa Malay
 ไทย
ไทย Español
 Deutsch
 Български
 Français
 Tiếng Việt
 中文
中文 বাংলা
বাংলা हिन्दी
 Čeština
 Українська
 Română

