Long positions on EUR/USD:
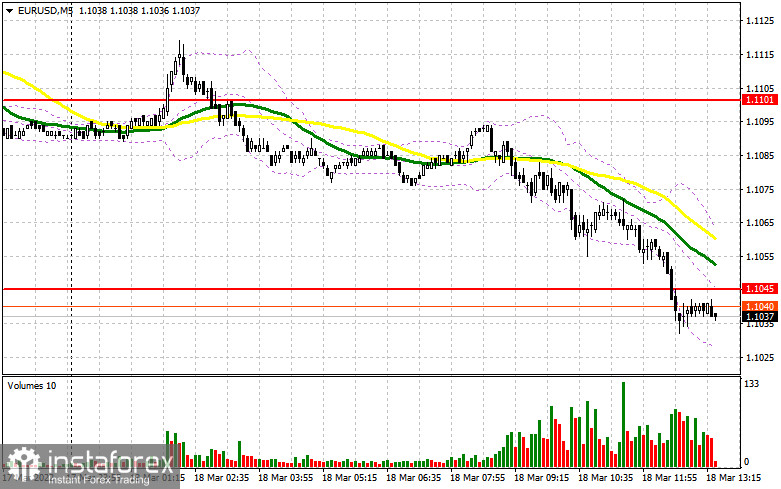
In my forecast this morning, I drew your attention to the level of 1.1045 and recommended entering the market from it. Let's have a look at the 5-minute chart and analyze what happened. In the first half of the day, bulls showed no activity at all. They did not manage to reach 1.1100 which led to the gradual withdrawal of the bulls from the market, who looked for a further rise in the pair, which brought the euro down to support at 1.1045. However, big players didn't show much interest in the market even at that level, as they ignored it and let the price consolidate below it. In the second half of the day, the technical picture had not changed, but the strategy had to be revised.

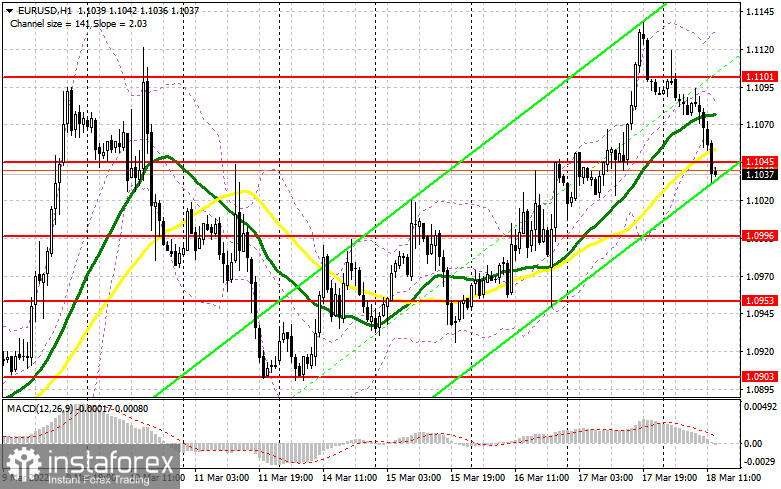
The lack of fundamental statistics and the fall of optimism among market participants regarding the reduction of geopolitical tensions led to a reduction in demand for risky assets, including the euro, which pushed the EUR/USD pair to the swing lows. In the afternoon today, a number of reports on the US economy were published, which may support the US dollar and lead to the market reversal in favor of the euro buyers. Bulls need to make some efforts to reach above 1.1045, which they failed to do in the first half of the day. Weak data on the US secondary market home sales and the index of leading indicators can help with that, and consolidation above 1.1045 with a reverse test top/bottom may give a signal to open long positions. The first target, in this case, will be resistance at 1.1101. In order to see a major upward move in the EUR/USD pair, it needs more activity and a breakthrough of this level. A top/bottom test at 1.1101 is likely to create a buy signal and open the way to 1.1165, which is a strong resistance that can change the balance of forces in the market in favor of bulls. The next target is a high of 1.1227, where traders may lock in profits. A breakthrough of this level is likely to cancel the bearish trend and trigger sellers' stop-loss orders, opening a direct way to the highs of 1.1271 and 1.1310. However, this scenario can be considered if there is good news about progress in the negotiations between Russia and Ukraine, which, unfortunately, are not scheduled for the near future. Therefore, it is useless to wait for the euro to advance. In the case of a further decline of the pair, it is better not to rush and postpone opening long positions until the nearest support at 1.0996 is tested. A false breakout of this range would be an optimal buy scenario, but to open long positions in the euro on the rebound would be possible only from 1.0953, allowing an upward intraday correction of 30-35 pips.
Short positions on EUR/USD:
Bears succeeded this morning dropping the pair below 1.1045. Unfortunately, I did not manage to get a sell signal, as I did not see a proper retest of this level. I think I will wait for it in the second half of the day. As long as the pair is trading below 1.1045, we can expect a further decline in the pair. Bears should hold a price below 1.1045 during the US session. A false breakout of this level, after the release of the US economic data, may create an excellent entry point, which will lead to a larger downside movement of the pair. The target is located at 1.0996. A breakthrough of this level may occur only in case of a more aggressive long position profit taking by the end of the week, as well as in case of a worsening of the geopolitical situation. It is reported that Putin discussed with German Chancellor Scholz the progress of the Russian special operation in Ukraine, stating that Moscow is ready to continue to seek solutions in line with its principled approaches in the talks. Also tonight, the Russian president will have a telephone conversation with Macron. An upward reversal test of 1.0996 would open short positions with the prospect of falling to 1.0953 and 1.0903. The new target is at a new low of 1.0855. If the euro grows and bears show a lack of activity at 1.1045, bulls are likely to open more long positions. In this case, it is better not to postpone selling the pair. The optimal scenario would be to go short if a false breakout occurs around 1.1101. Selling the EUR/USD on the rebound is possible from 1.1165 or higher near 1.1227, allowing a downward correction of 15-20 pips.

Signals of indicators:
Moving Averages
Trading is conducted near the 30- and 50-day moving averages, which indicates some market uncertainty with the trend.
Note: The period and prices of moving averages are considered by the author on the one-hour chart that differs from the general definition of the classic daily moving averages on the daily chart.
Bollinger Bands
In the case of growth, the resistance will be the middle boundary of the indicator around 1.1100.
Description of indicators
- Moving average (moving average, determines the current trend by smoothing volatility and noise). The period is 50. It is marked in yellow on the chart.
- Moving average (moving average, determines the current trend by smoothing volatility and noise). The period is 30. It is marked in green on the graph.
- MACD indicator (Moving Average Convergence/Divergence - convergence/divergence of moving averages). A fast EMA period is 12. A slow EMA period is 26. The SMA period is 9.
- Bollinger Bands. The period is 20.
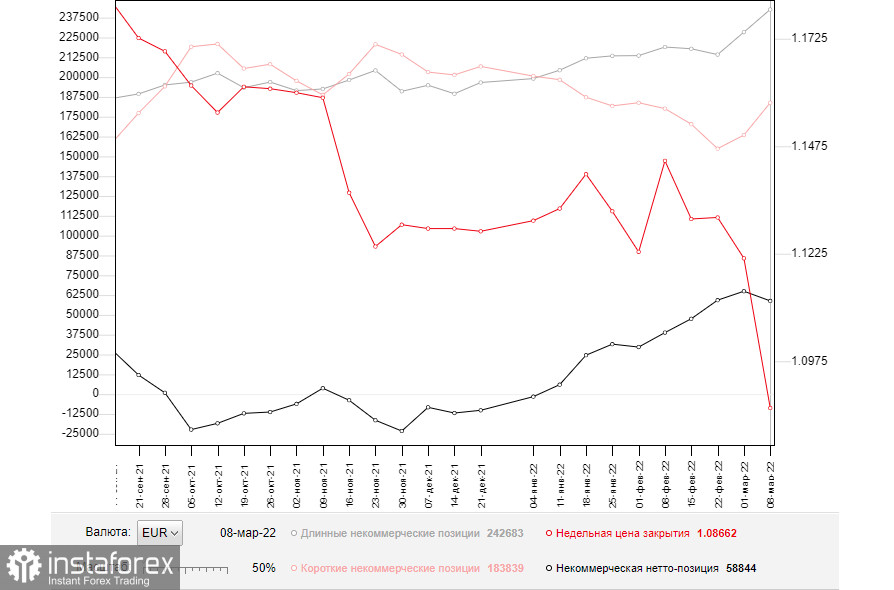
- Non-profit speculative traders are individual traders, hedge funds, and large institutions that use the futures market for speculative purposes and meet certain requirements.
- A long non-commercial position is a total long position opened by non-commercial traders.
- A short non-commercial position is a total short position opened by non-commercial traders.
- The total non-commercial net position is a difference between the short and long positions opened by non-commercial traders.
 English
 Русский
 Bahasa Indonesia
 Bahasa Malay
 ไทย
ไทย Español
 Deutsch
 Български
 Français
 Tiếng Việt
 中文
中文 বাংলা
বাংলা हिन्दी
 Čeština
 Українська
 Română

