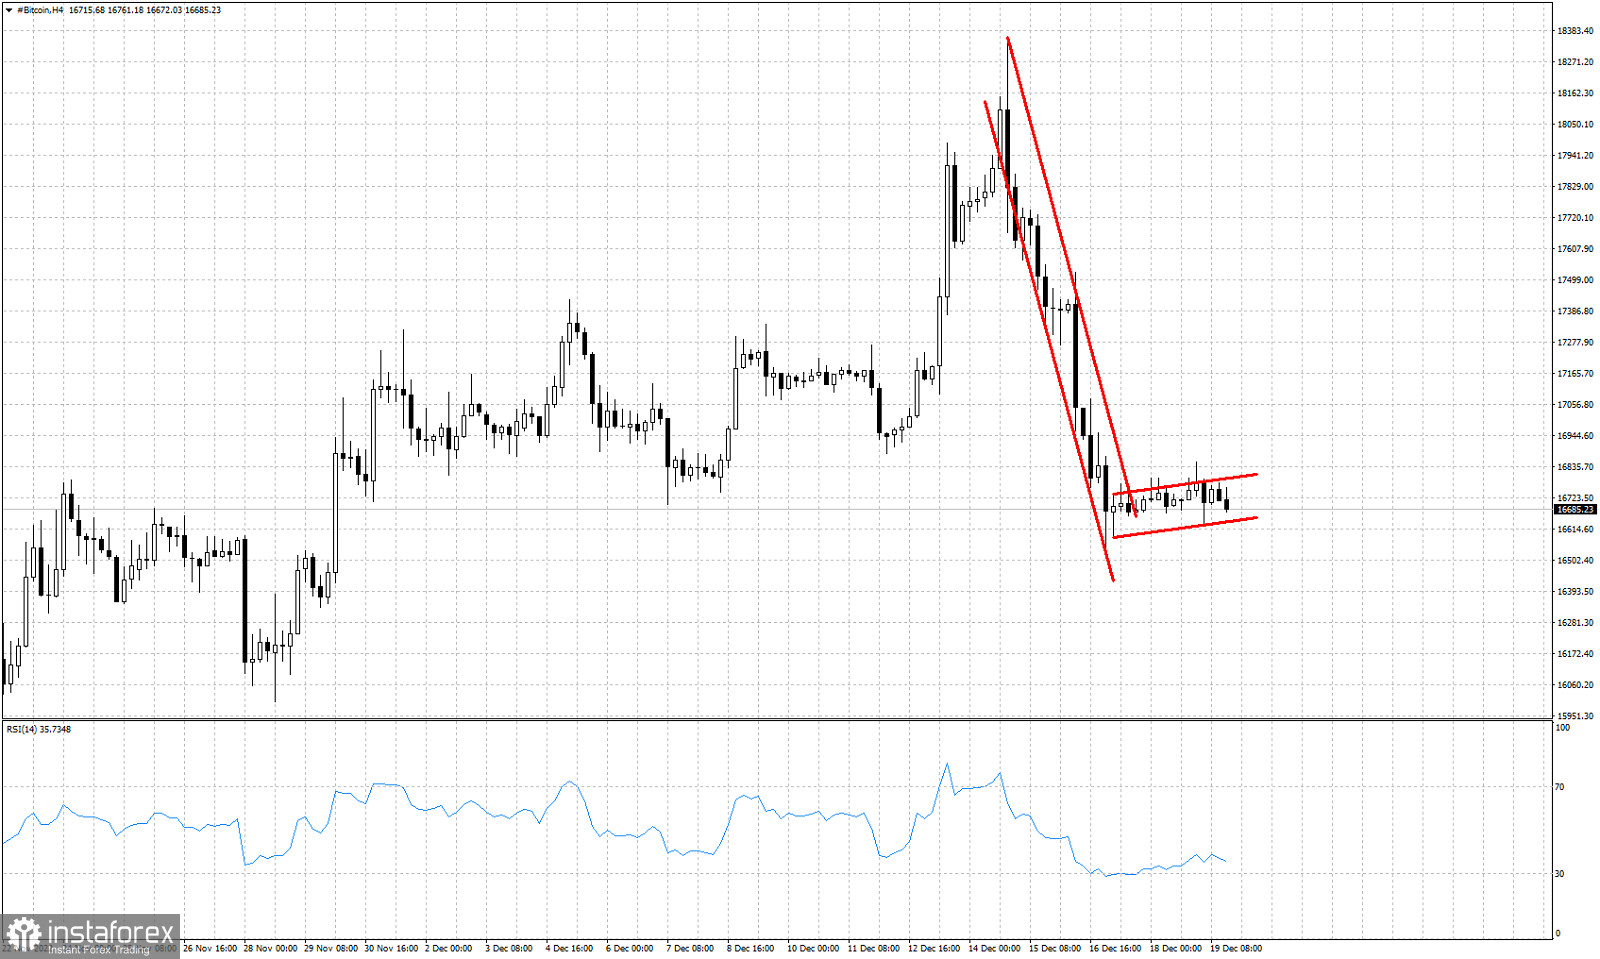
Red lines- bearish flag pattern
Bitcoin is trading around $16,720. Over the last two trading sessions price has stopped the decline and is moving sideways. In the 4 hour chart we observe a bearish flag pattern. A break below $16,540 will be an activation of the bearish flag, thus a new bearish signal. A break below $16,540 can lead Bitcoin to a decline to new 2022 lows or at least a back test of the 2022 lows. Medium-term trend remains bearish and Bitcoin is still vulnerable to new lows towards $12,000. Overall bears remain in control, however we have started seeing bullish RSI divergence signals on a weekly basis and this implies that the down trend is weakening.
 English
 Русский
 Bahasa Indonesia
 Bahasa Malay
 ไทย
ไทย Español
 Deutsch
 Български
 Français
 Tiếng Việt
 中文
中文 বাংলা
বাংলা हिन्दी
 Čeština
 Українська
 Română

