GBP/USD
Analysis:
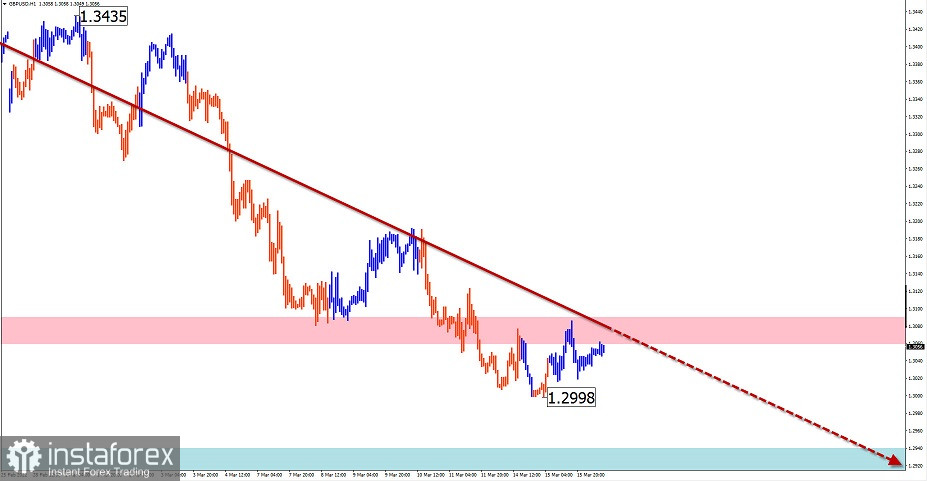
Over the past year and a half, the trend direction of the English pound sterling has been pointing south on the chart. The unfinished section has been counting down since January 13. The final part (C) is forming in the structure of this wave. After breaking through the support zone of the last trading days, the quotations form an intermediate pullback. Preliminary calculation shows the potential of the current decline to the 127th price figure.
Outlook:
Today, in the first half of the day, a general flat movement along the estimated resistance is expected. In the second half of the day we can expect an activation of price movements, an increase in volatility and resumption of the downward trend.
Potential reversal zones
Resistance:
- 1.3060/1.3090
Support:
- 1.2940/1.2910
Recommendations:
There are no buying conditions in the English pound market today. Trade transactions will become possible after the appearance of confirmed signals for sale.

AUD/USD
Analysis:
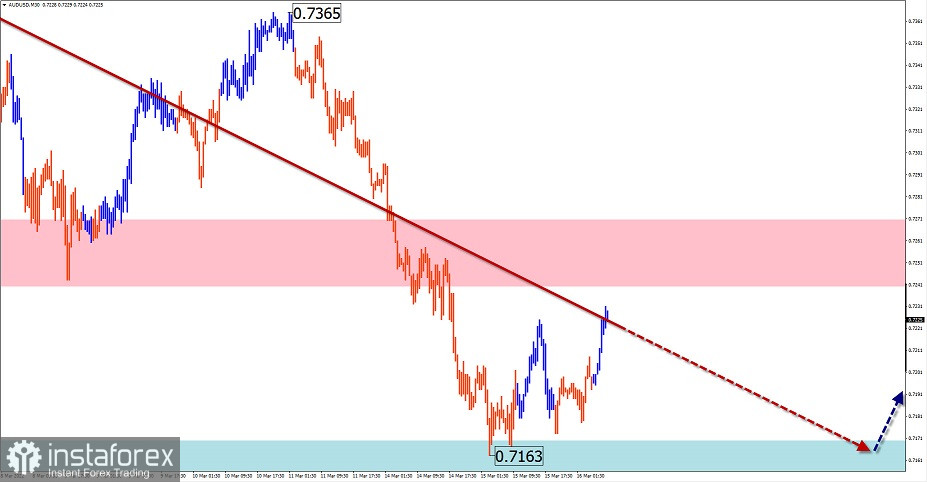
The latest incomplete wave in the dominant uptrend started at the end of January. In the last decade, the Australian dollar has been rolling back down into a retracement zigzag. As part of the retracement, an intermediate uptrend is forming in the last few days.
Outlook:
An overall sideways price movement is expected over the course of the current day. In the first half of the day, a slight rise to the resistance zone is likely. At the end of the day, probability of reversal and repeated decrease to the support area is increasing. Time of increased volatility may coincide with the release of important news.
Potential reversal zones
Resistance:
- 0.7240/0.7270
Support:
- 0.7170/0.7140
Recommendations:
Active trading in the Australian dollar market today could lead to losses. Short-term sales with fractional lots are possible from the resistance area. It is optimal to refrain from transactions in the pair's market until the appearance of confirmed buying signals in the area of estimated support.

USD/CHF
Analysis:
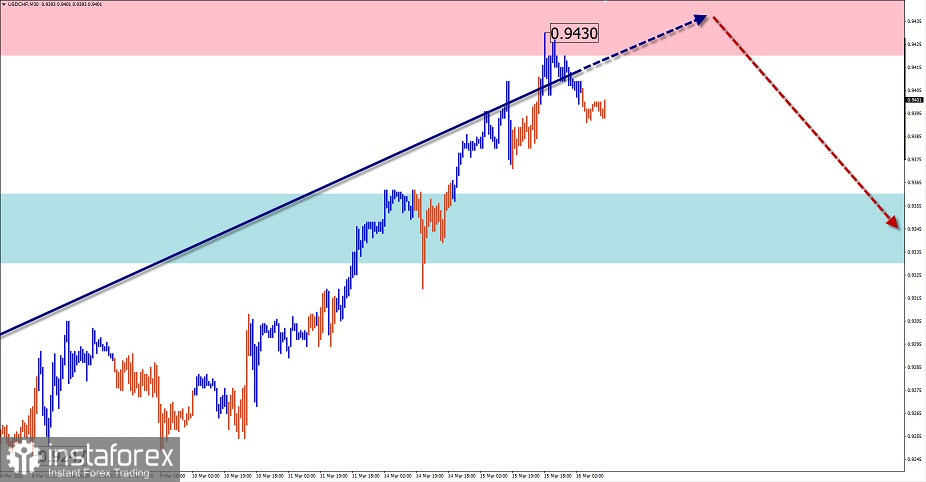
The descending wave structure that started on the Swiss franc chart last June most resembles a shifting or stretched plane in appearance. Its structure lacks the final section (C). Quotes have reached the lower border of the intermediate resistance zone.
Outlook:
In the near future, after probable pressure on the resistance zone, reversal formation and start of price decrease is expected. Estimated support demonstrates lower boundary of probable daily move.
Potential reversal zones
Resistance:
- 0.9420/0.9450
Support:
- 0.9360/0.9330
Recommendations:
There are no conditions for trading in the Swiss franc market today. The potential for growth is exhausted, while the conditions for opening short positions are not created. It is optimal to refrain from trading activity until there are confirmed signals in the resistance area of your trading system for sale.

USD/CAD
Analysis:
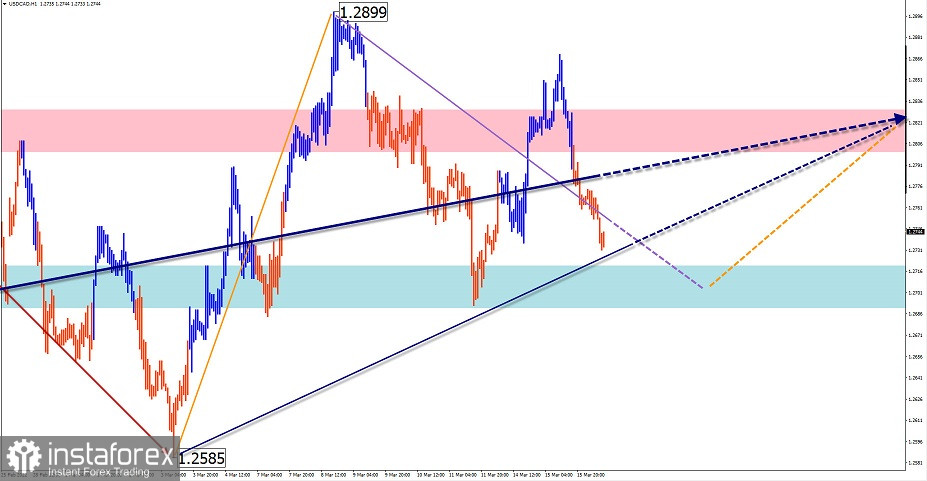
The direction of the price movement of the Canadian dollar major is set by the matching wave algorithm from January 13. On March 3, the final stretch started, in which the price will form a corrective zigzag in the last decade.
Outlook:
In the next 24 hours, the downward movement vector is expected to complete, form a reversal and resume price growth. Time of news release may serve as a reference point for increased volatility and change of direction.
Potential reversal zones
Resistance:
- 1.2800/1.2830
Support:
- 1.2720/1.2690
Recommendations:
The downside potential in the Canadian dollar market has been exhausted. After the appearance of confirmed signals of a reversal in the area of calculated support, it is recommended to open long positions.

Explanation: In the simplified wave analysis (UVA) waves consist of 3 parts (A-B-C). The last unfinished wave is analyzed. The solid arrow background shows the structure formed. The dotted arrow shows the expected movement.
Attention: The wave algorithm does not take into account the duration of the instrument movements over time!
 English
 Русский
 Bahasa Indonesia
 Bahasa Malay
 ไทย
ไทย Español
 Deutsch
 Български
 Français
 Tiếng Việt
 中文
中文 বাংলা
বাংলা हिन्दी
 Čeština
 Українська
 Română

