When to open long positions on GBP/USD:
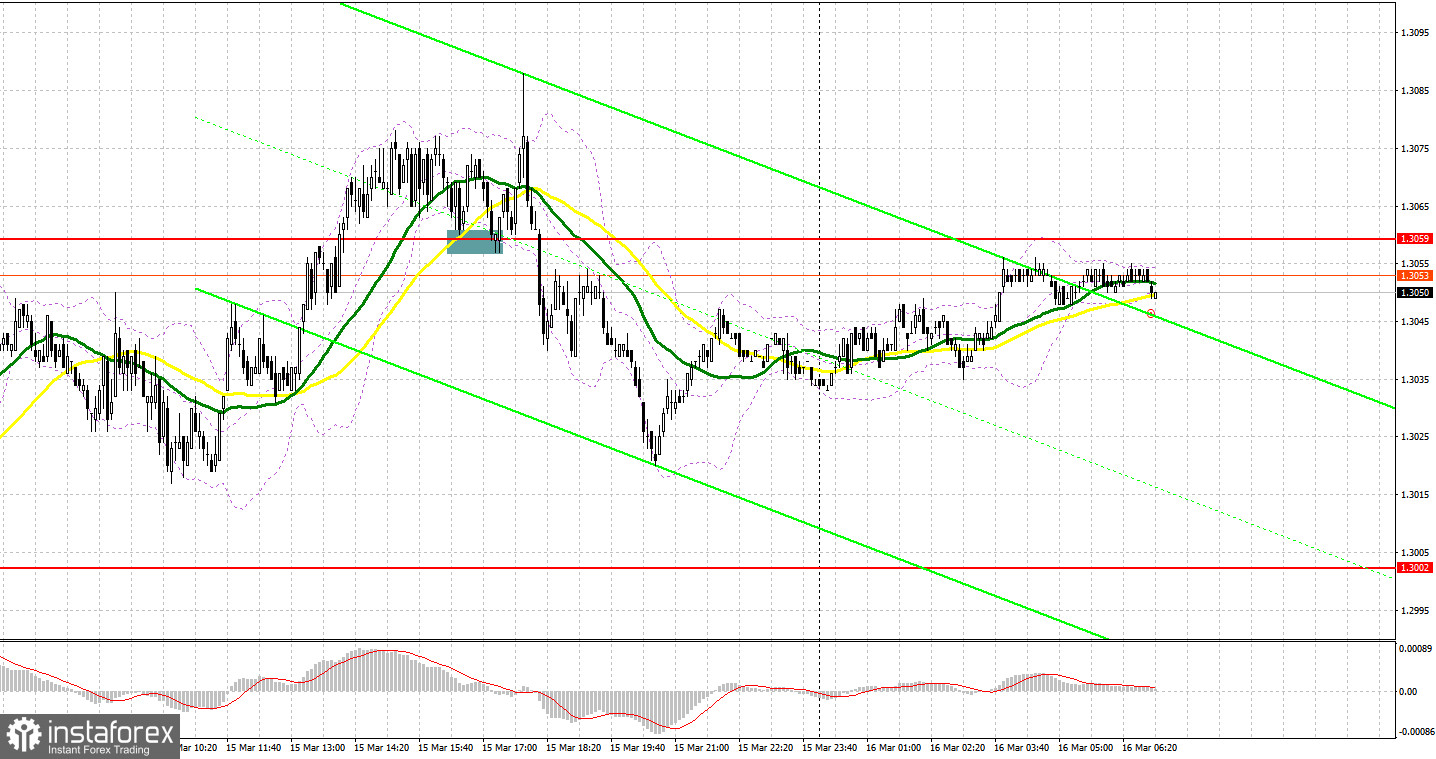
Yesterday, the pound sterling traded coolly. Let's turn to the M5 chart and analyze what happened. In my previous analysis, I paid attention to the 1.3059 level and said you could consider entering the market from it. In spite of strong labor market results in the United Kingdom, the pair was not able to reach the target due to extremely low volatility in the first half of the day. No entry signals were produced for the same reason. In the second half of the day, a signal to buy the asset was made when bulls broke through resistance at 1.3059 and tested the level from bottom to top. Overall, the pair rose by just 30 pips as it moved against the trend. Moreover, ahead of the FOMC meeting, the instrument would unlikely show a stronger upward movement.

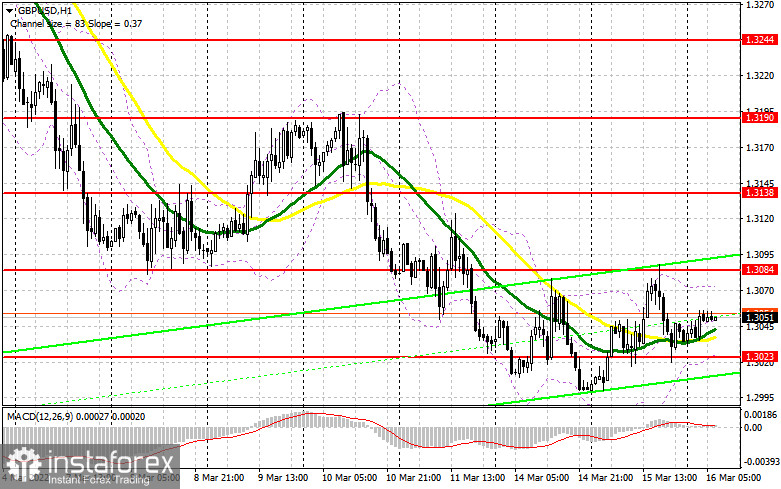
Today, the market will be solely focused on the FOMC meeting. We will soon find out what stance the Federal Reserve will adopt on monetary policy. There are two possible scenarios. The Fed will either become more aggressive towards interest rates in order to tame inflation or it will stick to the plan to raise them by 25 basis points. The Fed's decision might have a subtle effect on the pound. Meanwhile, risk appetite might increase tomorrow after the meeting of the Bank of England where aggressive measures could be taken to curb inflation. Due to the empty macroeconomic calendar in the UK, bulls will try to protect resistance at 1.3084, hoping to delay the pair's imminent fall after today's FOMC meeting. Another important goal will be protecting support at 1.3023 as GBP bulls are now starting to take interest in this level. Long positions could be opened from this mark after a false breakout. In the event of a further bullish move, the pair might return to resistance at 1.3084. A breakout and a test of this range from top to bottom could trigger stop orders of bears, allowing bulls to increase the number of long positions. In such a case, the target level is seen at 1.3138. If the price breaks through resistance at 1.3190, the bearish trend will slow down. It will only be possible due to dovish Chairman Powell. If so, you should consider taking a profit there. In the event of a fall during the European session and a decrease in bullish activity at 1.3023, which is in line with the bullish moving averages, long positions could be opened when the price reaches support at 1.2966 and only if there is a false breakout. Long positions on GBP/USD could be entered immediately on a rebound from 1.2911 or the 1.2856 low, allowing a 30-35 pips correction intraday.
When to open short positions on GBP/USD:
Bears are still maintaining control of the market. A lot will depend now on their activity at yearly lows. The pound is likely to remain bearish if volatility burst does not take place in the first half of the day. Nevertheless, GBP/USD might extend its bear run at any time due to the serious geopolitical situation in Ukraine, the upcoming FOMC meeting, and issues concerning the British economy caused by inflation hikes. Bears will try to protect support at 1.3023. A breakout and a retest of the level from bottom to top will make an additional sell signal, with targets at the 1.2966 and 1.2911 lows where you should consider taking a profit. The 1.2856 mark stands as a further target, which is highly unlikely to be approached due to the upcoming FOMC meeting. In the event of a rise in the first half of the day, a false breakout at 1.3084 will produce the first sell signal. In case of a decrease in bearish activity at 1.3084, short positions could be entered as soon as the price reaches support at 1.3138 and only if there is a false breakout. Short positions on GBP/USD could be entered immediately on a bounce from 1.3190 or the 1.3244 high, allowing a 20-25 pips correction intraday.


Indicator signals:
Moving averages
Trading is carried out slightly above the 30-day and 50-day moving averages, showing the attempts of bulls to resume the uptrend.
Note: The period and prices of moving averages are viewed by the author on the hourly chart and differ from the general definition of classic daily moving averages on the daily chart.
Bollinger Bands
The lower band at 1.3023 stands as support. Resistance is seen at 1.3080, in line with the upper band.
Indicator description:
- Moving average (MA) determines the current trend by smoothing volatility and noise. Period 50. Colored yellow on the chart.
- Moving average (MA) determines the current trend by smoothing volatility and noise. Period 30. Colored green on the chart.
- Moving Average Convergence/Divergence (MACD). Fast EMA 12. Slow EMA 26. SMA 9.
- Bollinger Bands. Period 20
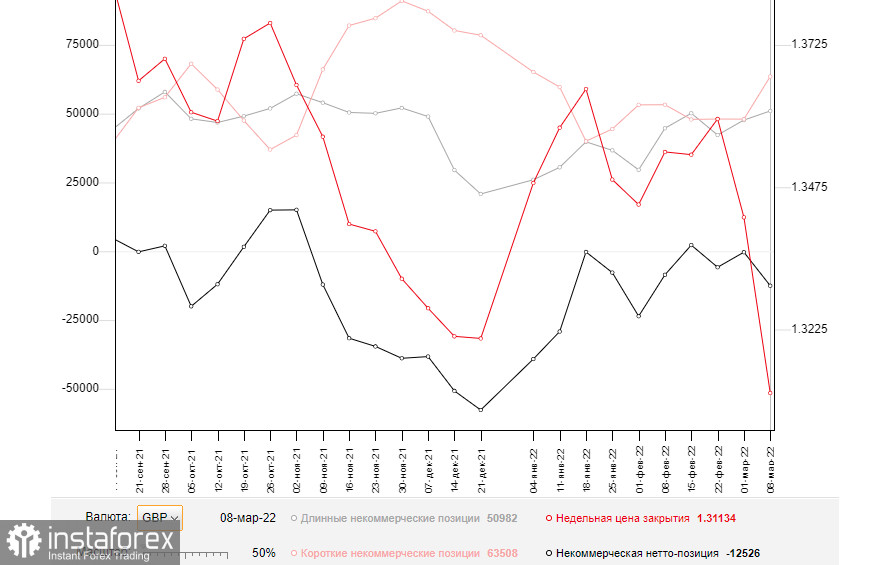
- Non-commercial traders are speculators such as individual traders, hedge funds, and large institutions who use the futures market for speculative purposes and meet certain requirements.
- Long non-commercial positions are the total long position of non-commercial traders.
- Non-commercial short positions are the total short position of non-commercial traders.
- Total non-commercial net position is the difference between short and long positions of non-commercial traders.
 English
 Русский
 Bahasa Indonesia
 Bahasa Malay
 ไทย
ไทย Español
 Deutsch
 Български
 Français
 Tiếng Việt
 中文
中文 বাংলা
বাংলা हिन्दी
 Čeština
 Українська
 Română

