Details of the economic calendar of March 14:
Monday is traditionally accompanied by a blank macroeconomic calendar. Nevertheless, the information and news flow will continue to put pressure on the market.
Analysis of trading charts from March 14
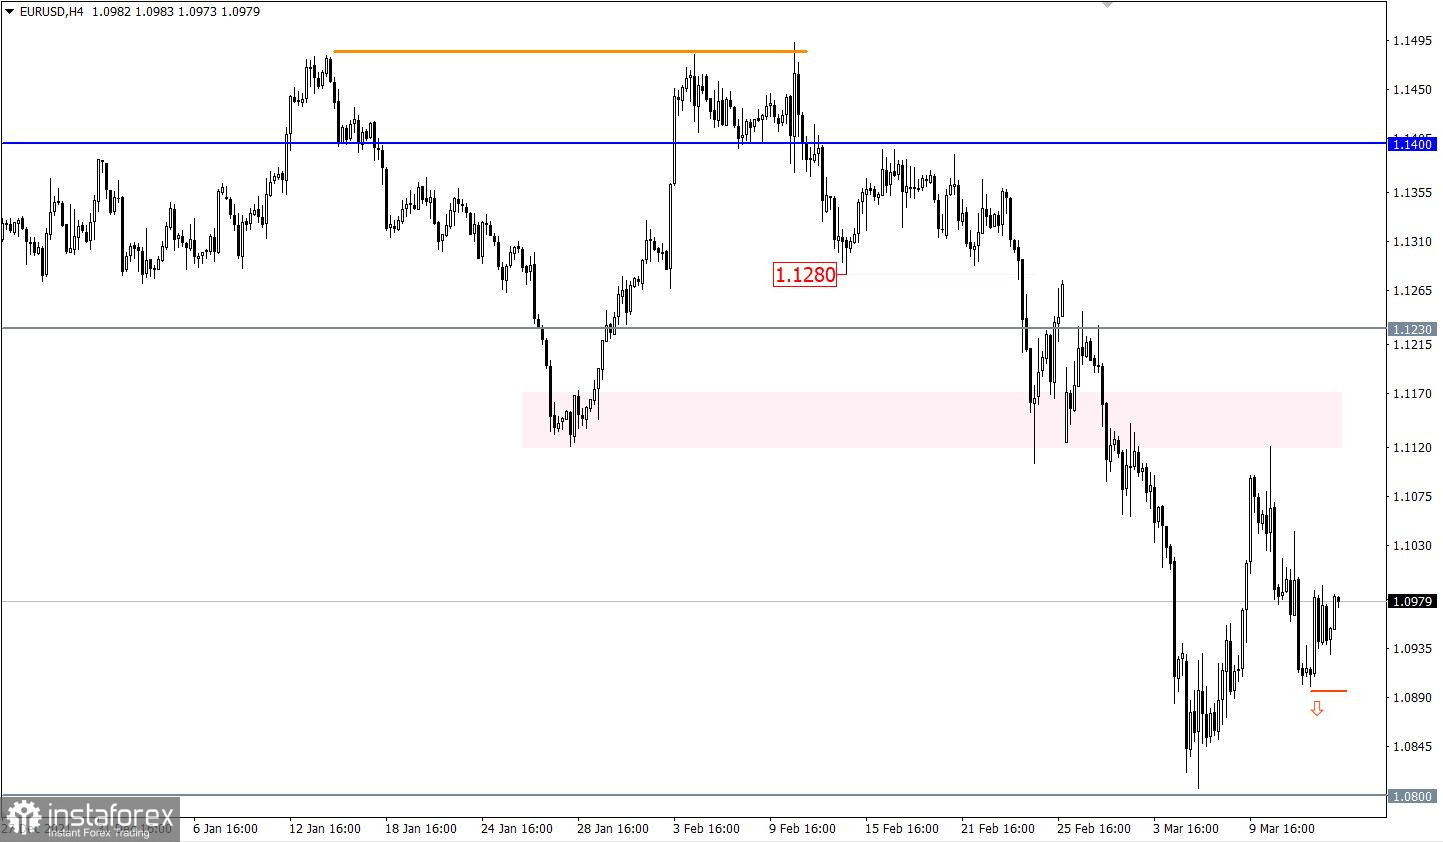
The EURUSD currency pair formed a slight stagnation around the value of 1.0900 on the way to restore the downward movement. This led to a reduction in the volume of short positions and, as a result, a price pullback.
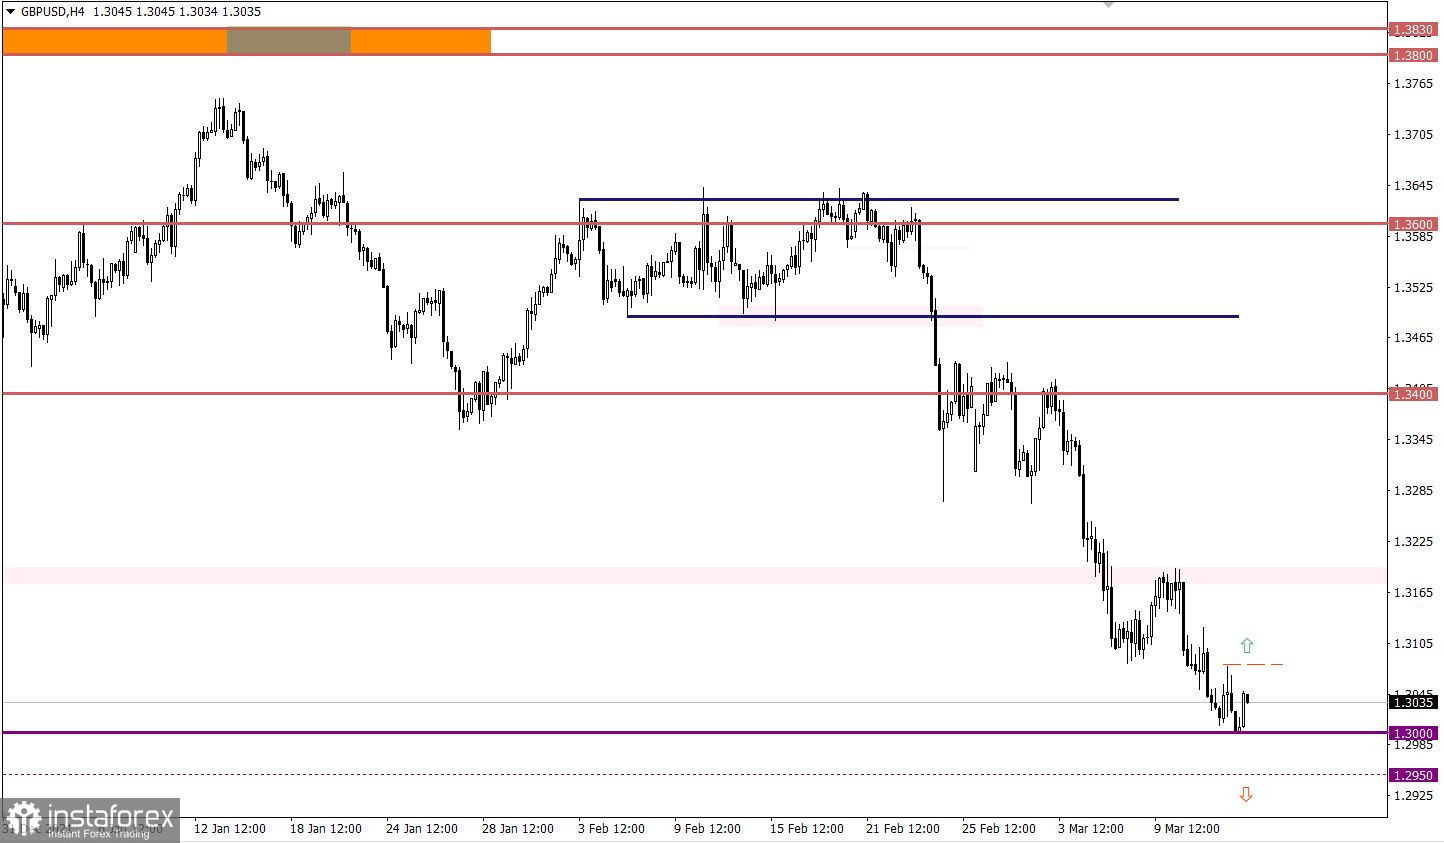
The GBPUSD currency pair approached the level of 1.3000 with surgical precision, where the downward movement slowed down. The psychological level puts pressure on sellers, but in this situation, it is considered by traders only as a variable foothold on the path of a downward trend.

March 15 economic calendar:
Today is a more eventful day in terms of macroeconomic data. At 07:00 UTC, indicators on the UK labor market were published, where the unemployment rate fell 4.1% to 3.9%. In addition, the number of applications for benefits decreased by 48,000 in the period of February, which is good news. The reaction of the pound sterling is quite restrained, probably the market is affected by information and news noise.
In Europe, the publication of data on industrial production is expected, the growth rate of which should slow down from 1.6% to 1.1%. Please note that this data is for January. In the current situation in the form of sanctions, the data for February, and even more so for March, will turn out to be even worse.
During the American trading session, the producer price index in the United States will be published, where it is expected to grow from 9.7% to 10.0%. This signals that rising producer prices will, as a result, stimulate consumer prices, i.e. inflation will continue to rise.
Time targeting
EU industrial production - 10:00 UTC
U.S. producer price index - 12:30 UTC
Trading plan for EUR/USD on March 15:
In this situation, the subsequent downward move will be considered by traders only after holding the price below the 1.0900 mark in a four-hour period. This step is highly likely to lead the quote to the pivot point of 1.0800. Until then, the market is in a pullback stage.

Trading plan for GBP/USD on March 15:
Despite the high desire of traders to continue to form a downward trend, the level of 1.3000 has a negative impact on the volume of short positions. This can lead to a slowdown in the downward cycle and, as a result, a price pullback.
In this situation, a double scenario regarding the psychological level will be considered. Buy positions come from the pullback stage, they will be relevant if the price holds above 1.3080. While the sell positions will be taken into account after the price is kept below 1.2950.

What is reflected in the trading charts?
A candlestick chart view is graphical rectangles of white and black light, with sticks on top and bottom. When analyzing each candle in detail, you will see its characteristics of a relative period: the opening price, closing price, and maximum and minimum prices.
Horizontal levels are price coordinates, relative to which a stop or a price reversal may occur. These levels are called support and resistance in the market.
Circles and rectangles are highlighted examples where the price of the story unfolded. This color selection indicates horizontal lines that may put pressure on the quote in the future.
The up/down arrows are the reference points of the possible price direction in the future.
 English
 Русский
 Bahasa Indonesia
 Bahasa Malay
 ไทย
ไทย Español
 Deutsch
 Български
 Français
 Tiếng Việt
 中文
中文 বাংলা
বাংলা हिन्दी
 Čeština
 Українська
 Română

