What is needed to open long positions on EUR/USD
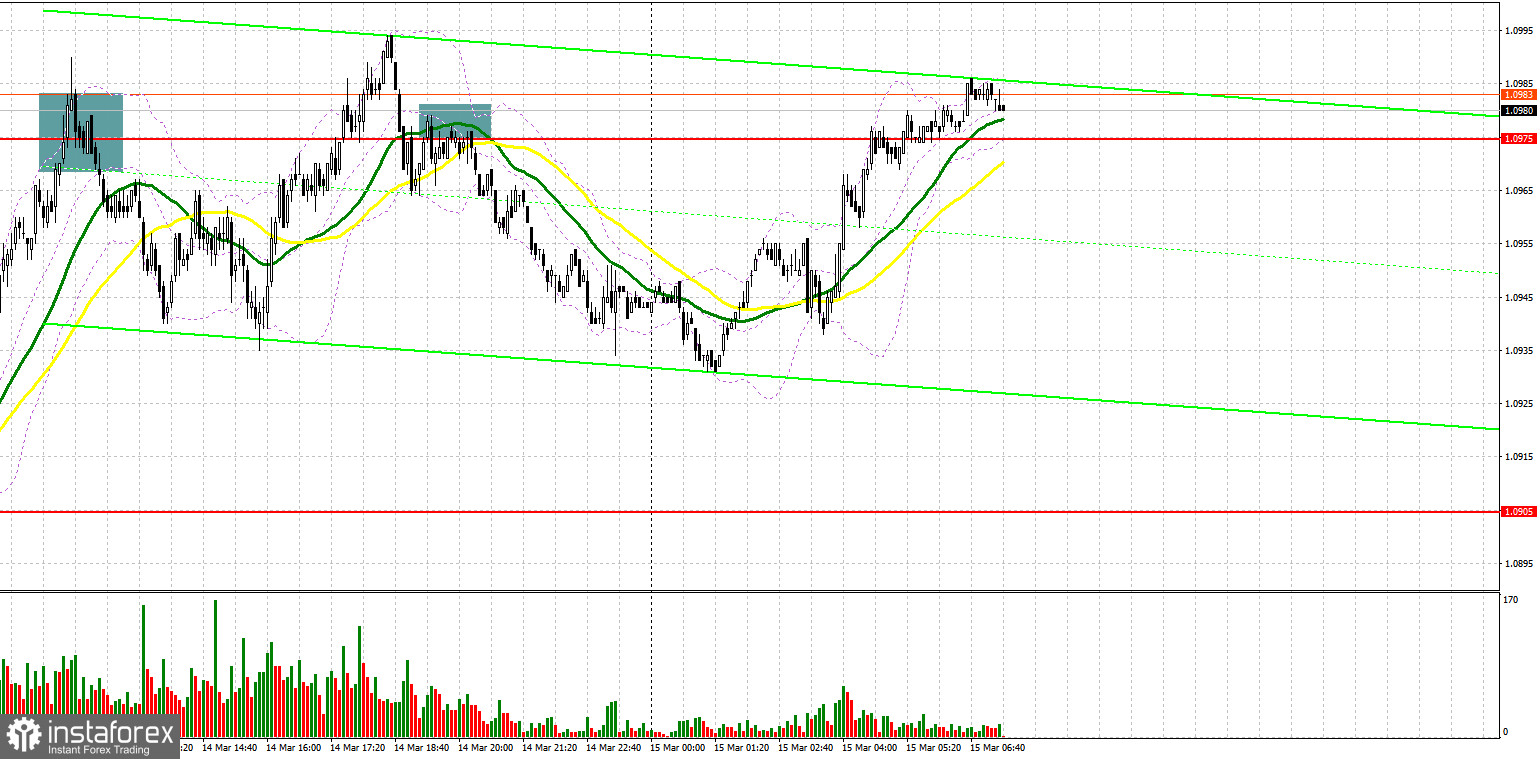
Yesterday, there were several profitable entry points. Let's look at the 5-minute chart and try to figure out what actually has happened. In the morning article, I highlighted the level of 1.0968 and recommended taking decisions with this level in focus. As seen on the chart, bulls pushed the euro to 1.0968. A sell signal appeared due to a false breakout. The euro/dollar pair lost more than 30 pips. In the afternoon, the bulls once again tried to push the price above the level of 1.0975 but failed. As a result, there was a new sell signal because of the return of the price to this range and an upward test. The euro once again declined by more than 40 pips

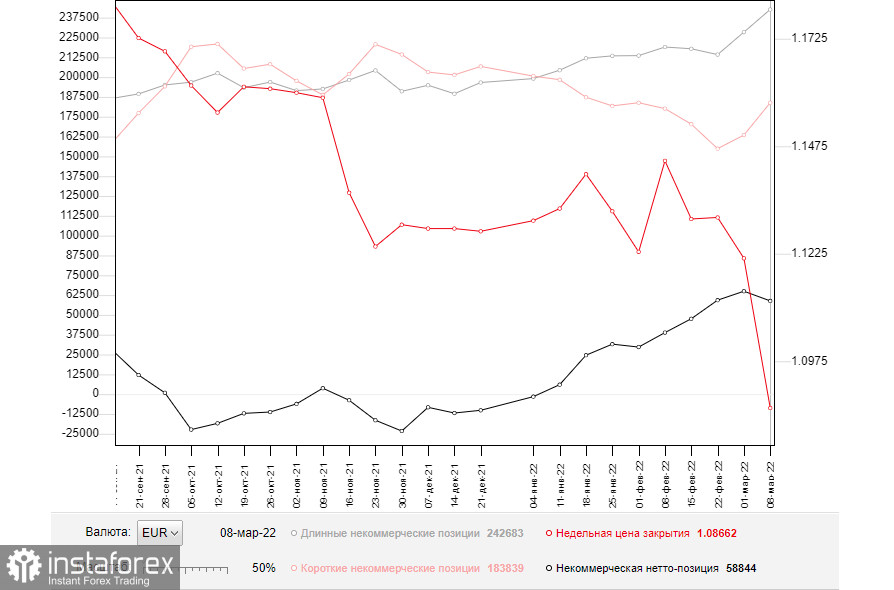
Before moving on to the future prospects of the EUR/USD pair, let's look at what happened in the futures market and how the positions of Commitment of Traders changed. The COT report (Commitment of Traders) for March 8 logged an increase in both long and short positions. It is hardly surprising as there have been more bears than bulls in the market since the start of the war in Ukraine. It led to a drop in the positive delta. However, the bulls are not ready to give even in times of a sell-off of the euro. Trades continue to actively increase long positions, taking advantage of attractive prices. Last week, the ECH held a meeting. The regulator had finally clarified its plans for monetary policy. Risk appetite slightly strengthened after the meeting even despite escalating geopolitical tensions. Christine Lagarde announced plans for a more aggressive tapering of asset purchases to boost the economy and raise the interest rate. It was a strong bullish medium-term signal for EUR bulls. However, keep in mind that this week the Fed will also hold a meeting. Analysts are trying to figure out which decisions the central bank could make to combat the highest inflation in the last 40 years. Apart from that, Russia and Ukraine returned to the negotiating table. Yet, so far these talks have not brought any results. Therefore, it is recommended to open long positions on the US dollar as the bearish trend for the EUR/USD pair is likely to persist. The COT report reveals that the number of long non-commercial positions rose to 242,683 from 228,385, while the number of short non-commercial positions grew to 183,839 from 163,446. At the end of the week, the total non-commercial net position decreased to 58,844 against 64,939. The weekly closing price fell to 1.0866 from 1.1214.

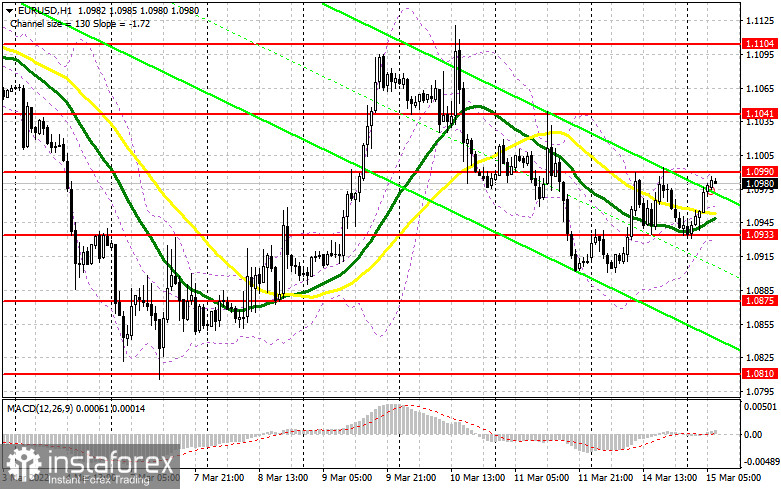
Today, market volatility is likely to be quite high. This is why traders should be very careful today when opening long positions on the euro. Besides, analysts expect rather discouraging reports from Germany and the euro area today. Even though investors are ready for negative data as well as for the Fed's meeting scheduled for tomorrow, risky assets are unlikely to regain ground. The only scenario for opening long positions, which I do not recommend doing in the current situation, is to go long after the euro declines to 1.0933 in the first half of the day. At this level, the moving averages are passing in the positive zone. Only the formation of a false breakout there and negative data on the IFO Business Climate Index for Germany and the euro area will give buy signals. Besides, there will be a high chance of the resumption of an upward correction that began yesterday. Apart from a false breakout, bulls need to push the euro higher. If the bulls show no activity at 1.0933, it is better to postpone long positions. A breakout of this level may lead to another large sell-off of risky assets. In this case, I advise buying EUR/ USD only after the pair approaches the next support level of 1.0875. However, I would recommend you to enter the market only if a false breakout takes place. Immediately open long positions for a rebound from 1.0810 or from the next annual low of 1.0772 and 1.0728, keeping in mind an intraday upward correction of 30-35 pips. An equally important task for bulls will be to take control of the 1.0990 level formed yesterday. Risk appetite is sure to increase amid a breakout and consolidation of the pair above this range as well as positive economic data for France's consumer price index and the EU industrial production, and hawkish statements by ECB President Christine Lagarde. If so, there will be an excellent entry point into long positions. The target levels are located at highs of 1.1041 and 1.1104. If the pair breaks above these levels, the bullish correction may start. So, the pair is likely to reach 1.1165 where I recommend profit-taking.
What is needed to open short positions on EUR/USD
As long as the price holds below 1.0990, the bears will keep control over the market. For this reason, the ongoing upward correction may end at any moment. If data on the IFO Business Climate Index for Germany and the eurozone turns out to be weak, it will certainly increase pressure on the pair. It is better to sell the euro in the first half of the day if there is a formation of a false breakout at the level of 1.0990. It will provide an excellent entry point into short positions with the prospect of a further decline to the level of 1.0933. The pair decreased to this level yesterday. At this level, the moving averages are passing in the positive zone. Weak data on the EU countries, which is of high importance, may serve as a catalyst for the bearish trend A breakout and an upward test of 1.0933 will give an additional entry point. As a result, the pair may slide down to a low of 1.0875 and 1.0810 where I recommend profit-taking. A test of this level will only strengthen the bearish trend for the euro. A more distant target level will be 1.0772. If the pair recovers during the European session and bears show no activity at 1.0990, it is recommended to sell the euro after a false breakdown at 1.1041. It is possible to open short positions on EUR/USD immediately for a rebound from the highs of 1.1104 and 1.1165, keeping in mind a downward correction of 20-25 pips.

Signals of technical indicators
Moving averages
EUR/USD is trading above 30- and 50-period moving averages. It means that the bulls don't give up attempts to carry on with an upward correction.
Remark. The author is analyzing a period and prices of moving averages on the 1-hour chart. So, it differs from the common definition of classic daily moving averages on the daily chart.
Bollinger Bands
A breakout of the upper border at about 1.0990 will trigger a new bullish wave of EUR. Alternatively, a breakout of the lower border at about 1.0933 will escalate pressure on EUR/USD.
Definitions of technical indicators
- Moving average recognizes an ongoing trend through leveling out volatility and market noise. A 50-period moving average is plotted yellow on the chart.
- Moving average identifies an ongoing trend through leveling out volatility and market noise. A 30-period moving average is displayed as the green line.
- MACD indicator represents a relationship between two moving averages that is a ratio of Moving Average Convergence/Divergence. The MACD is calculated by subtracting the 26-period Exponential Moving Average (EMA) from the 12-period EMA. A 9-day EMA of the MACD called the "signal line".
- Bollinger Bands is a momentum indicator. The upper and lower bands are typically 2 standard deviations +/- from a 20-day simple moving average.
- Non-commercial traders - speculators such as retail traders, hedge funds and large institutions who use the futures market for speculative purposes and meet certain requirements.
- Non-commercial long positions represent the total long open position of non-commercial traders.
- Non-commercial short positions represent the total short open position of non-commercial traders.
- The overall non-commercial net position balance is the difference between short and long positions of non-commercial traders.
 English
 Русский
 Bahasa Indonesia
 Bahasa Malay
 ไทย
ไทย Español
 Deutsch
 Български
 Français
 Tiếng Việt
 中文
中文 বাংলা
বাংলা हिन्दी
 Čeština
 Українська
 Română

