GBP/USD 5M

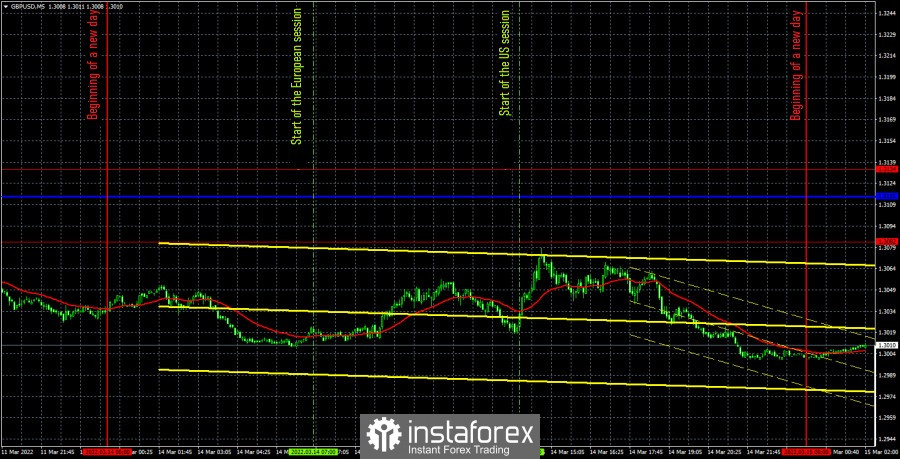
The GBP/USD currency pair tried to adjust most of the day on Monday, but by the end of the day it turned out to be at about the same level at which it started. Thus, the attempt to adjust can be called a failure. The volatility of the pound/dollar was quite low, which is quite unusual. There were no important macroeconomic statistics or foundations on Monday, so in some way the weak volatility and lack of trend movement are justified. Nevertheless, the pound once again failed to grow normally, so the option with its further fall remains the main one. This week, in addition to the Federal Reserve meeting, there will also be a Bank of England meeting, but judging by the beginning of the week, traders are still not set up to buy the British currency.
There were no trading signals on Monday. From our point of view, this is even for the best, because the whole movement was more like a flat, and even with low volatility. That is, the worst option for traders, and last Friday perfectly demonstrated what happens when there is no trend and bundles of signals are formed around the same level. In general, not a single trade deal was opened yesterday. We are waiting for important events this week and stronger movements.
COT report:

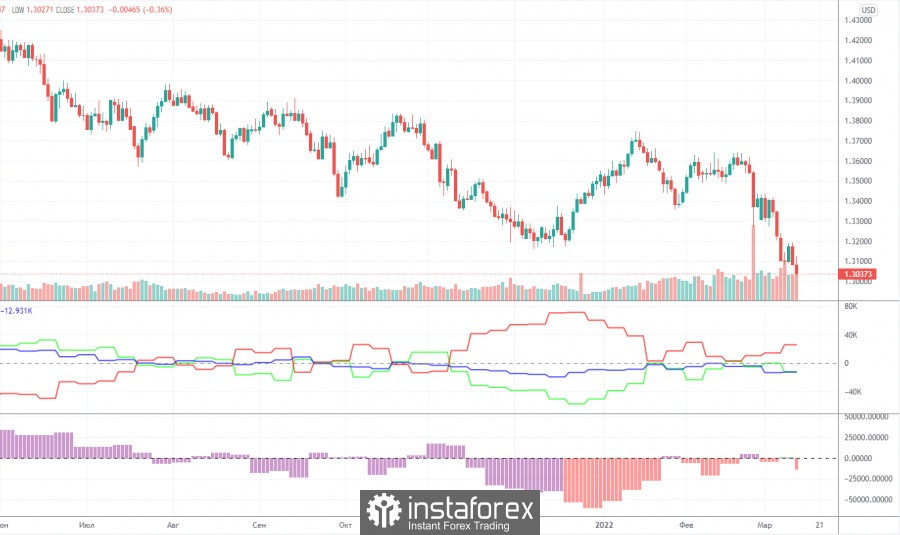
The latest Commitment of Traders (COT) report on the British pound showed an increase in the "bearish" mood among professional traders. However, in general, the mood of major players has changed too often in recent months, which is clearly seen by the two indicators in the chart above. At the moment, the number of open long positions is less than the number of short positions by 13,000. Although a week ago their numbers were almost the same. We can conclude that the major players cannot make a decision on exactly how to trade the pound. Of course, with the beginning of the military operation in Ukraine, a lot has changed for traders and investors. There was outright panic in the markets for several days. But even now, when enough time has passed to calm down, the markets are still in an excited state. In addition, strong demand for the US dollar also affects the movement of the pound/dollar pair, so COT reports do not always reflect what is actually happening in the market. Although the reports on the British pound are at least a little consistent. The green line of the first indicator (the net position of the "non-commercial" group) indicates that the major players are starting to look at the short positions on the British pound again. And since this line is not far from the zero mark, the pound has a lot to go down. In general, now most factors speak in favor of the growth of the US currency and COT reports are just one of them. At this time, geopolitics is the most important factor.
We recommend that you familiarize yourself with:
Overview of the EUR/USD pair. March 15. The conflict between Ukraine and the Russian Federation persists. It is still difficult for the euro currency to grow.
Overview of the GBP/USD pair. March 15. Two meetings of central banks. What to expect?
Forecast and trading signals for EUR/USD on March 15. Detailed analysis of the movement of the pair and trading transactions.
GBP/USD 1H

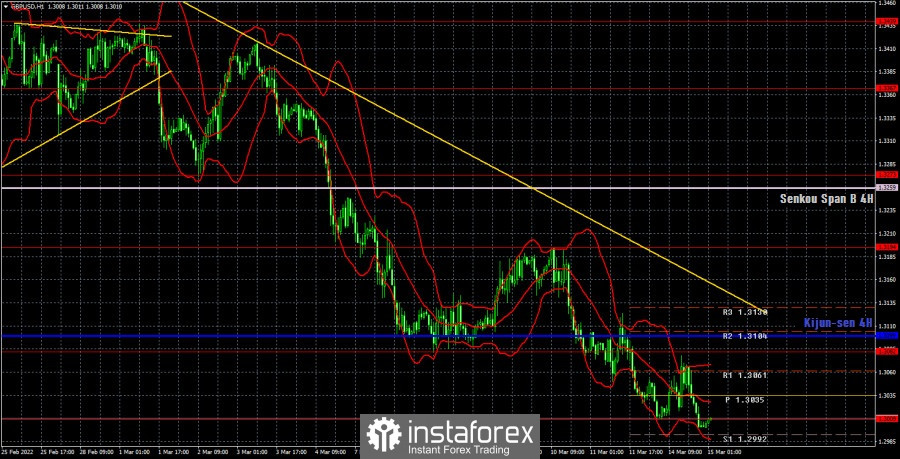
The pair maintains a downward trend on the hourly timeframe, and the price does not even try to approach the downward trend line. Therefore, the pound now has absolutely no strength or desire to grow against the dollar. Perhaps the mood of traders will change a little after the meetings of the Fed and the Bank of England, but it's too early to talk about it now. On March 15, we highlight the following important levels: 1.3009, 1.3082, 1.3194, 1.3273. The Senkou Span B (1.3259) and Kijun-sen (1.3099) lines can also be signal sources. Signals can be "bounces" and "breakthroughs" of these levels and lines. It is recommended to set the Stop Loss level to breakeven when the price passes in the right direction by 20 points. The lines of the Ichimoku indicator can move during the day, which should be taken into account when determining trading signals. There are also support and resistance levels on the chart that can be used to take profits on transactions. Several publications are scheduled for Tuesday in the UK. In particular, quite important data on unemployment and the number of applications for unemployment benefits. We believe that only very strong data, which does not correspond to the forecast as much as possible, can slightly affect the movement of the pair. Even relatively important reports are not planned in America. Therefore, today the pair will move again on "technique" or "geopolitics". And, most likely, on both.
Explanations for the chart:
Support and Resistance Levels are the levels that serve as targets when buying or selling the pair. You can place Take Profit near these levels.
Kijun-sen and Senkou Span B lines are lines of the Ichimoku indicator transferred to the hourly timeframe from the 4-hour one.
Support and resistance areas are areas from which the price has repeatedly rebounded off.
Yellow lines are trend lines, trend channels and any other technical patterns.
Indicator 1 on the COT charts is the size of the net position of each category of traders.
Indicator 2 on the COT charts is the size of the net position for the non-commercial group.
 English
 Русский
 Bahasa Indonesia
 Bahasa Malay
 ไทย
ไทย Español
 Deutsch
 Български
 Français
 Tiếng Việt
 中文
中文 বাংলা
বাংলা हिन्दी
 Čeština
 Українська
 Română

