 English
  Русский
 Bahasa Indonesia
 Bahasa Malay
 ไทย
ไทย Español
 Deutsch
 Български
 Français
 Tiếng Việt
 中文
中文 বাংলা
বাংলা हिन्दी
 Čeština
 Українська
 Română

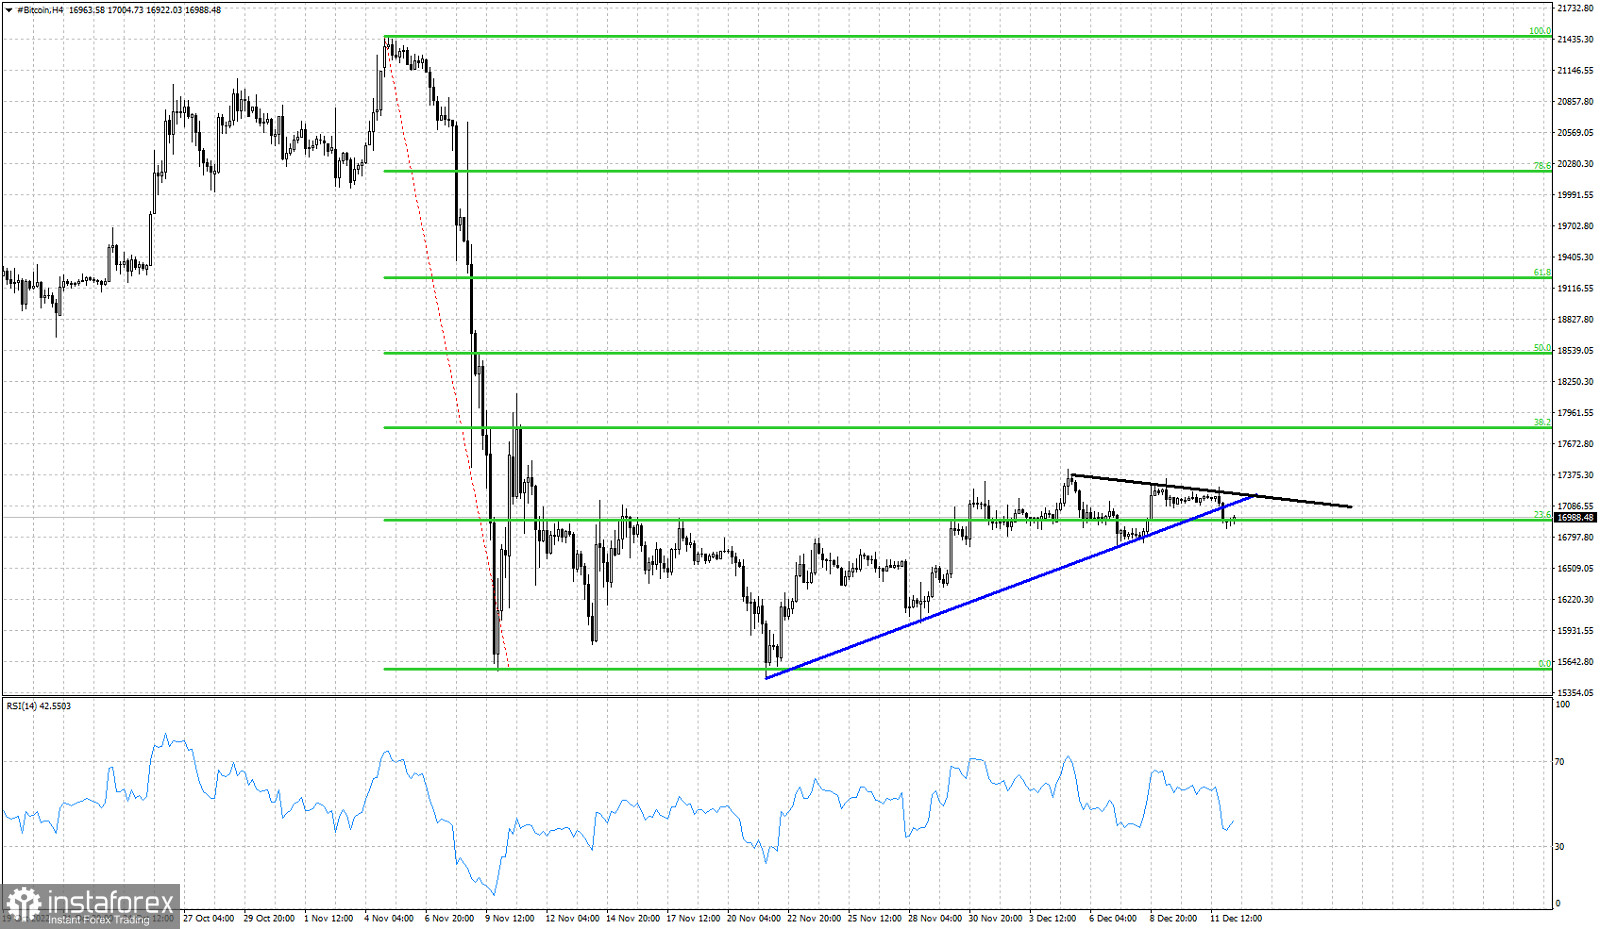
Green lines- Fibonacci retracements
Blue line- support trend line (broken)
Black line- resistance trend line
Bitcoin is trading around $16,980. Price has broken below the upward sloping support trend line and has formed lower highs. Bulls remain very weak unable to even push towards $18,000. Bitcoin continues to move mostly sideways since the sharp sell off in early October after the FTX scandal. Price has been mostly trading around the 23.6% Fibonacci retracement. So far the blue trend line was respected but not any more. Price has broken below it. Resistance is now found at $17,200. Horizontal support is at $16,700 and if broken, we should expect a move lower towards November lows.