Technical Market Outlook:
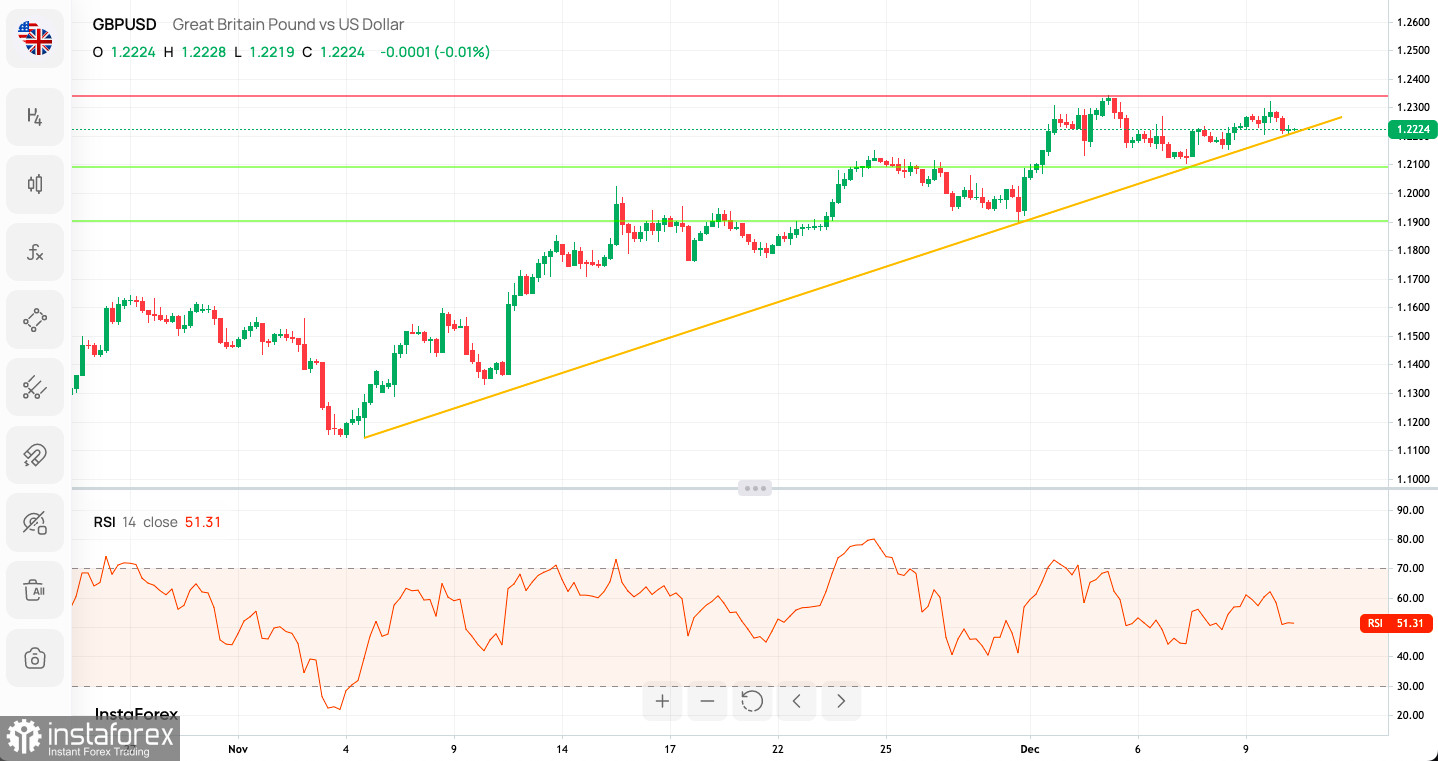
The GBP/USD pair has been seen trading close to the weekly high seen at the level of 1.2343 and still above the trend line support. The nearest technical support is still seen at 1.2106, so in a case of an unexpected breakout lower, the next target for bears is seen at 1.1897 (30th November low). Also, please notice the Bearish Divergence between the price and the momentum indicator that might have an impact on the next bearish movement. The momentum is neutral, so any breakout lower and down move extension is possible.

Weekly Pivot Points:
WR3 - 1.22823
WR2 - 1.22537
WR1 - 1.22388
Weekly Pivot - 1.22251
WS1 - 1.22102
WS2 - 1.21965
WS3 - 1.21679
Trading Outlook:
The bulls are temporary in control of the market and the 50% Fibonacci retracement of the last big wave down located at 1.2293 had been tested, so a down trend resumption is possible. On the other hand, the level of 1.0351 has not been tested since 1985, so the down trend is strong. In order to terminate the down trend, bulls need to close the weekly candle above the level of 1.2275 (swing high from August 10th).
 English
 Русский
 Bahasa Indonesia
 Bahasa Malay
 ไทย
ไทย Español
 Deutsch
 Български
 Français
 Tiếng Việt
 中文
中文 বাংলা
বাংলা हिन्दी
 Čeština
 Українська
 Română

