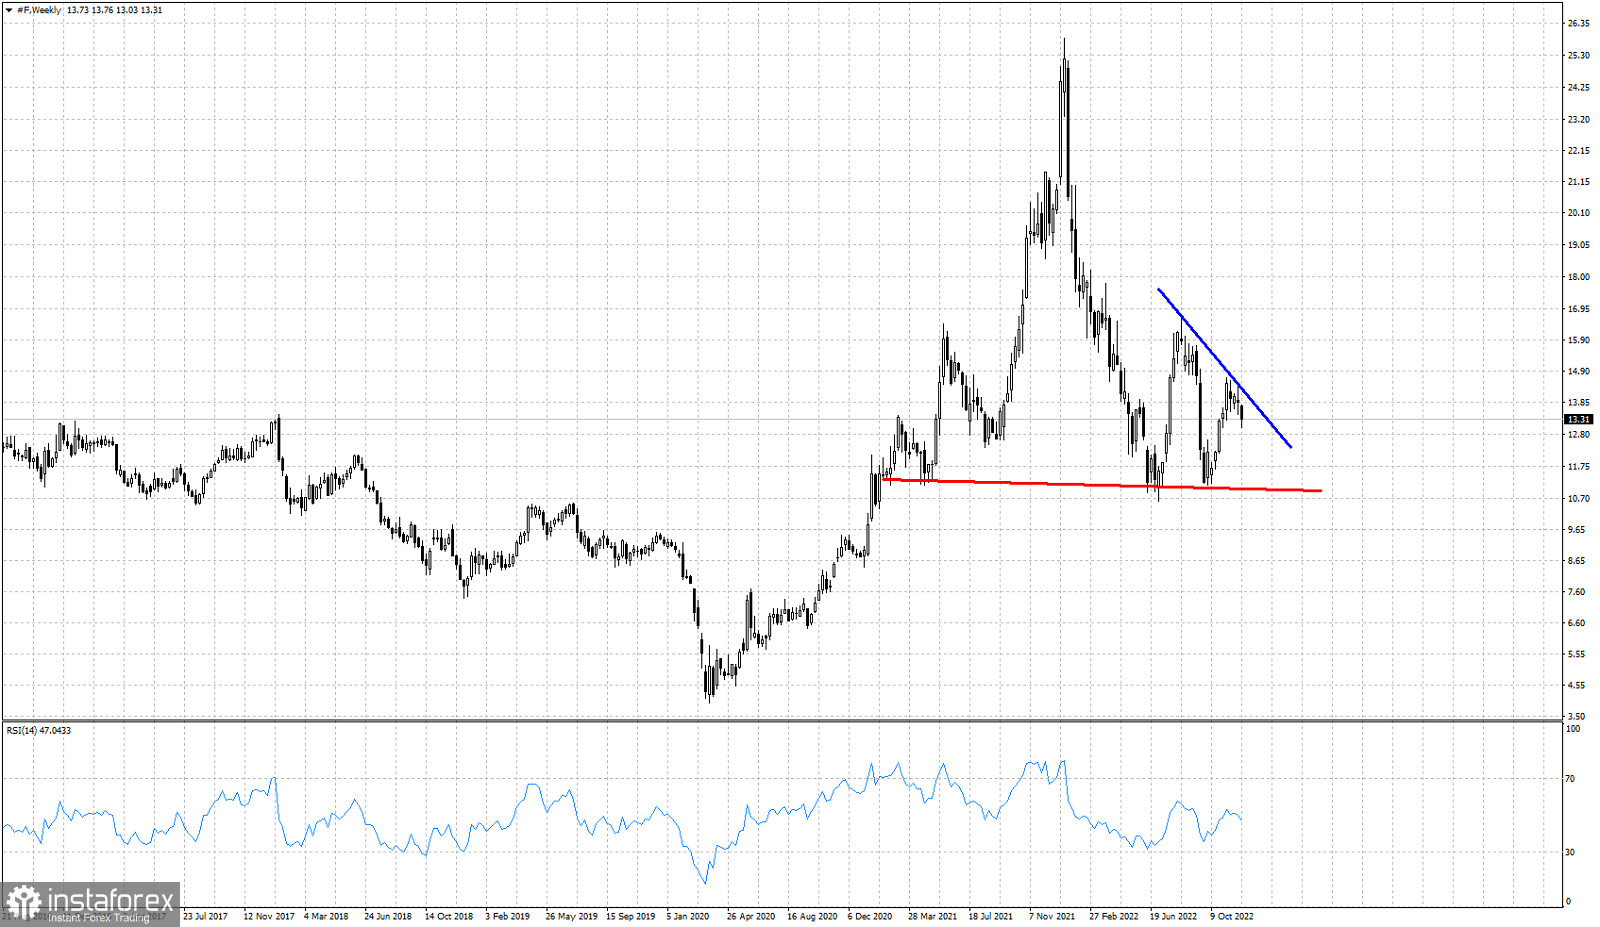
Red line- neckline- support
Blue line- short-term resistance trend line
Ford stock price continues to respect the key neckline support around $11, but the bounce that followed the recent low at $11.13 was weaker than the previous one and provided a lower high. The Head and Shoulders pattern remains in play and the recent lower high increases the chances of breaking the neckline support. At $14.30 we find short-term resistance by the downward sloping trend line. A break above this resistance trend line would be good news for bulls. As long as price is below this trend line, we expect F stock price to move lower to test once again the neckline support around $11.
 English
 Русский
 Bahasa Indonesia
 Bahasa Malay
 ไทย
ไทย Español
 Deutsch
 Български
 Français
 Tiếng Việt
 中文
中文 বাংলা
বাংলা हिन्दी
 Čeština
 Українська
 Română

