Initial jobless claims fell by 18,000 to 215,000 in the week of Feb. 20-26, the U.S. Department of Labor said on Thursday, against a revised value of 233,000 in the previous week. Thus, the number of initial claims for unemployment benefits in the U.S. last week remained near historical lows, which indicates a shortage of resources in the country's labor market.
This report was another confirming signal after the publication on Wednesday of ADP data on private sector employment on the stability of the American labor market after its collapse in early 2020 due to the coronavirus pandemic. Now market participants are waiting for the publication today at 13:30 (GMT) of the official monthly report of the U.S. Department of Labor with employment data in February. Economists expect an increase in wages, an increase in the number of jobs by 440,000, and a decrease in unemployment to 3.9%. These are very strong indicators that should strengthen the market's opinion that the Fed is determined to tighten its monetary policy.
In his speech before the U.S. Congress on Thursday, Fed Chairman Jerome Powell said that he does not exclude that the agency will take a wait-and-see attitude during the meeting at the end of March, given the situation around Ukraine. Although personally, he is determined to raise the interest rate.
Meanwhile, market participants prefer to take a wait-and-see position on the eve of the publication of the official report of the U.S. Department of Labor, hoping to receive additional confirmation of the possibility of raising interest rates during the March meeting of the Fed.
Moderate pressure on the position of the dollar is exerted by macroeconomic statistics published yesterday from the U.S. Thus, the PMI index in the services sector from ISM fell to 56.5 in February (against 59.9 in January and the forecast of 61.0). The employment index in the services sector from the ISM for the same period also fell sharply (to 48.5 from 52.3 and against the forecast of 53.5).
Uncertainty around the military conflict in Ukraine has a negative impact on investor sentiment, supporting the traditional defensive asset gold. It is not known to bring investment income, but is a popular defensive asset, especially in the face of rising inflation and geopolitical tensions. Its quotes are extremely sensitive to changes in the monetary policy of the world's leading central banks, especially the Fed. When it tightens, the quotes of the national currency (under normal conditions) tend to grow, while the price of gold falls.
However, as we can see from the long-term charts, its price is not going to fall. At the time of writing this article, the XAU/USD pair is near 1938.00, preparing to end this week higher.
According to analysts of the gold market, the dynamics of its prices will depend on "whether investors' fears about inflation will intensify and whether interest rates will rise faster than expected." At the same time, we can assume that gold has room for growth, given the military conflict between Russia and Ukraine.
Technical analysis and trading recommendations
As noted above, at the time of writing, the XAU/USD pair is trading near 1938.00, remaining in a long-term bull market and moving within an ascending channel on the daily chart. Its upper border passes near the mark of 1990.00, above the local 17-month high of 1974.00 reached last week. The mark of 1990.00 will be a reference point in case of further growth of XAU/USD and after the breakdown of the local resistance level of 1974.00. A more distant target, which so far looks theoretical, is 2074.00, reached in August 2020.
Data from the U.S. points to a rapid acceleration in inflation, which the Fed may simply not be able to keep up with if it takes a less aggressive stance on monetary policy than markets expect. And the closer the March meeting of the Fed, the stronger the volatility in dollar and gold quotes will grow. In the meantime, long positions look preferable in the XAU/USD pair.
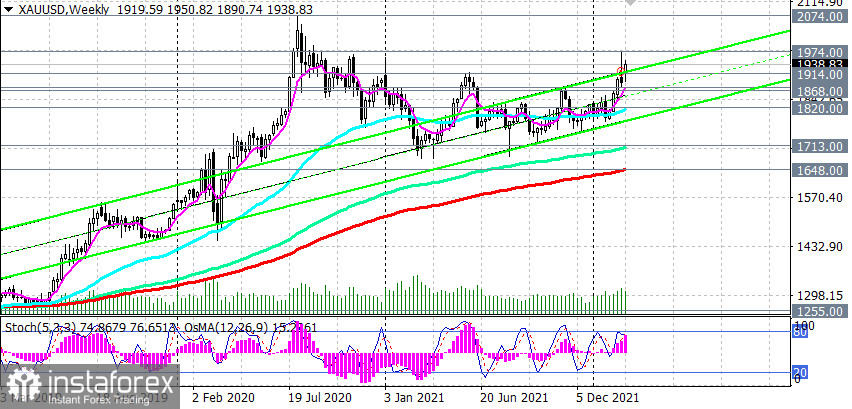
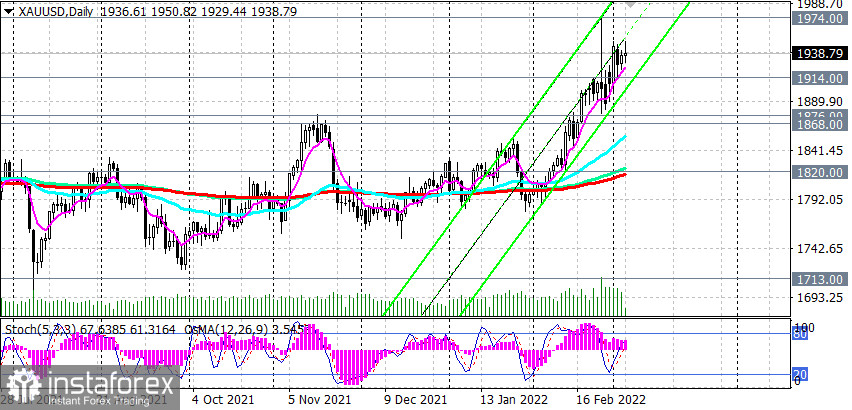
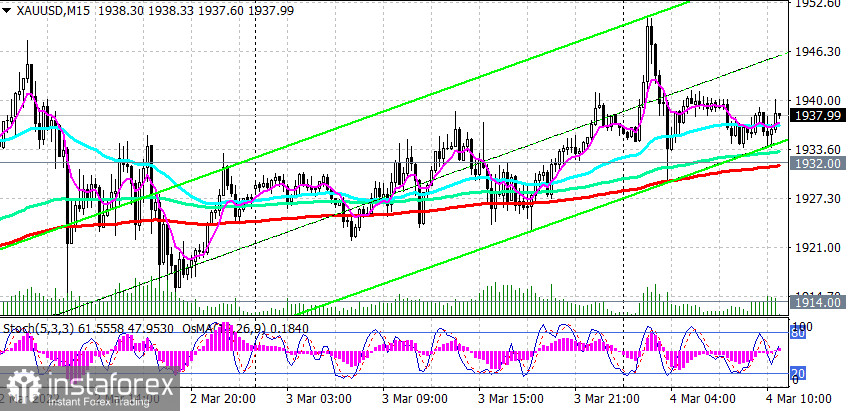
In an alternative scenario, XAU/USD will return to the key long-term and psychologically important support level of 1800.00. The first signal for the implementation of this scenario will be a breakdown of the short-term support level of 1932.00 (200 EMA on the 15-minute chart), and a breakdown of the support level of 1914.00 (200 EMA on the 1-hour chart) will strengthen the corrective downward dynamics, sending XAU/USD to the support levels of 1876.00, 1868.00 (200 EMA on the 4-hour chart). However, only a breakdown of the support levels of 1713.00 (144 EMA on the weekly chart), 1648.00 (200 EMA on the weekly chart) will increase the risks of breaking the long-term bullish trend of XAU/USD.
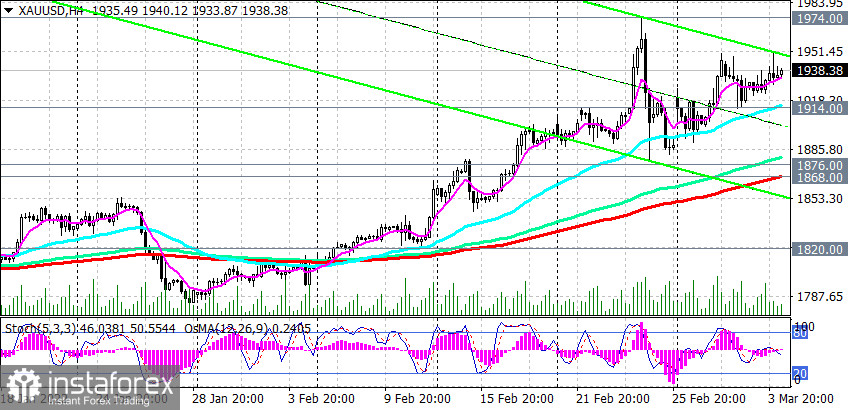
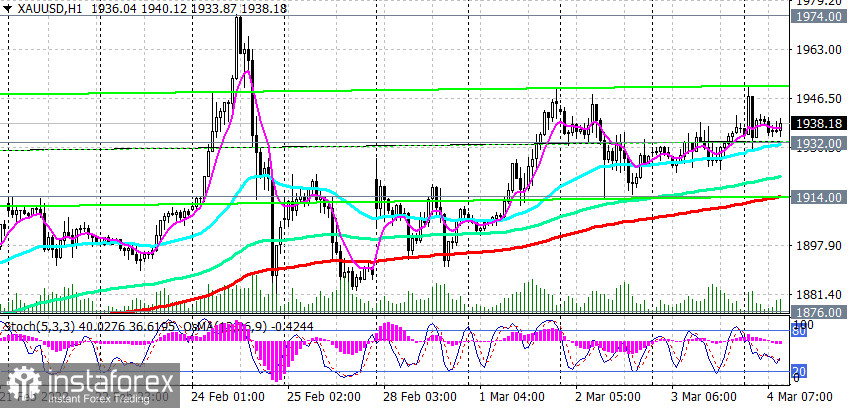
Support levels: 1932.00, 1914.00, 1876.00, 1868.00, 1820.00, 1800.00, 1713.00, 1700.00, 1648.00
Resistance levels: 1974.00, 2000.00, 2010.00, 2074.00
Trading recommendations
XAU/USD: Sell Stop 1928.00. Stop-Loss 1951.00. Take-Profit 1914.00, 1876.00, 1868.00, 1820.00, 1800.00, 1713.00, 1700.00, 1648.00
Buy Stop 1951.00. Stop-Loss 1928.00. Take-Profit 1960.00, 1970.00, 1995.00, 2000.00, 2070.00
 English
 Русский
 Bahasa Indonesia
 Bahasa Malay
 ไทย
ไทย Español
 Deutsch
 Български
 Français
 Tiếng Việt
 中文
中文 বাংলা
বাংলা हिन्दी
 Čeština
 Українська
 Română

