EUR/USD

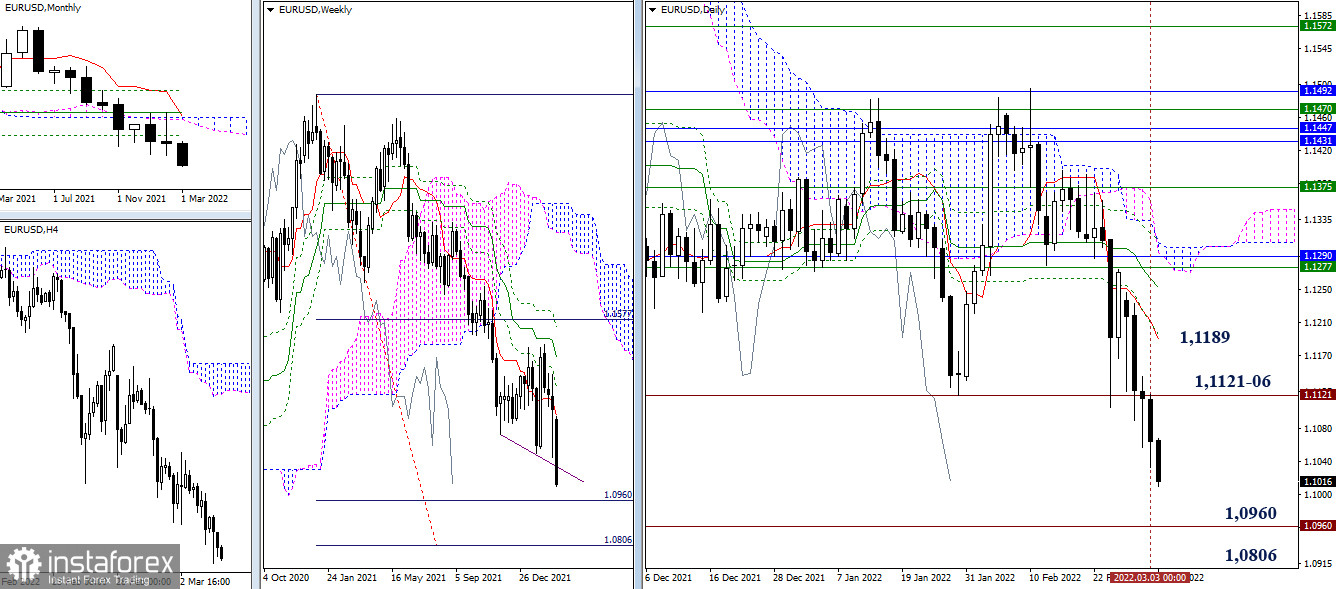
The decline continues. The main reference point for bears now is the downside target for the breakdown of the weekly Ichimoku cloud (1.0960 – 1.0806). The passed zone of lowest extremum points (1.1121-06) plays the role of resistance today, it will be the first to start working during the rise in case of a change of priorities.

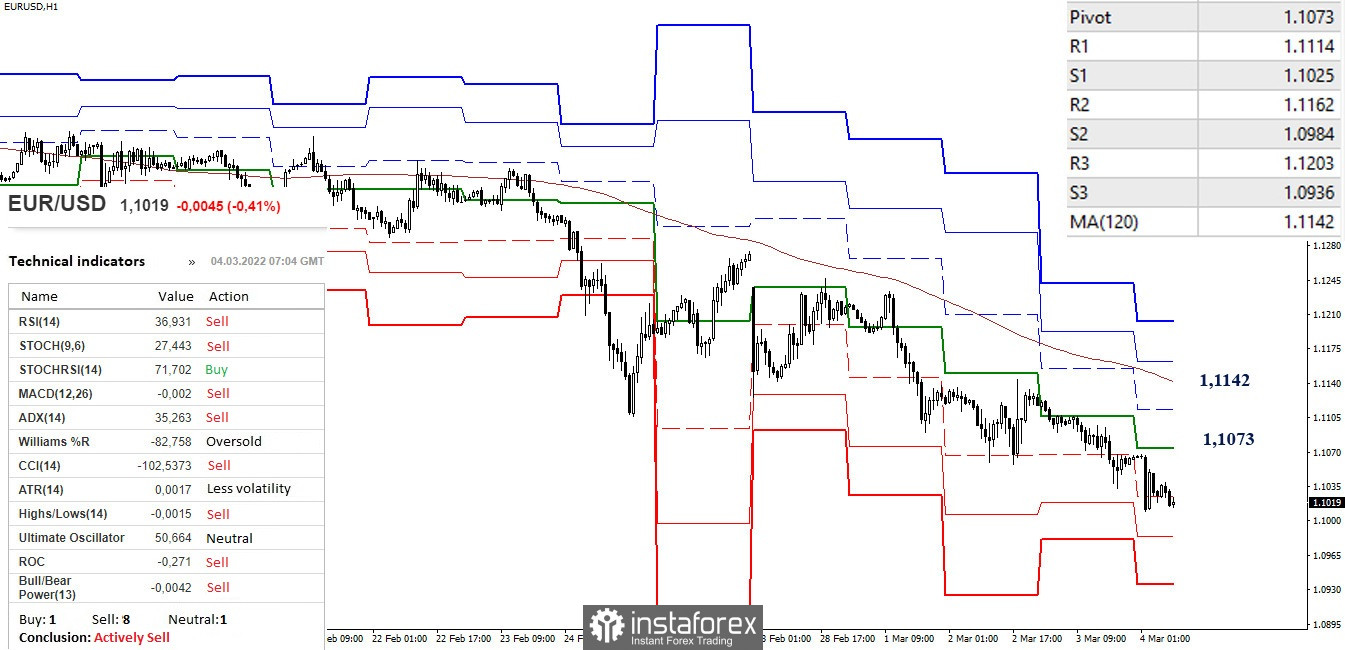
In the lower timeframes, the advantage belongs entirely to the bears. They realize the development of a downward trend. The support of the classic pivot points (1.0984 - 1.0936) can serve as benchmarks for the continuation of the decline within the day today. The key levels of the lower timeframes now retain the role of resistance and are currently located at 1.1073 (central pivot point) and 1.1142 (weekly long-term trend), the level of 1.1114 (R1) may provide intermediate resistance.
***
GBP/USD

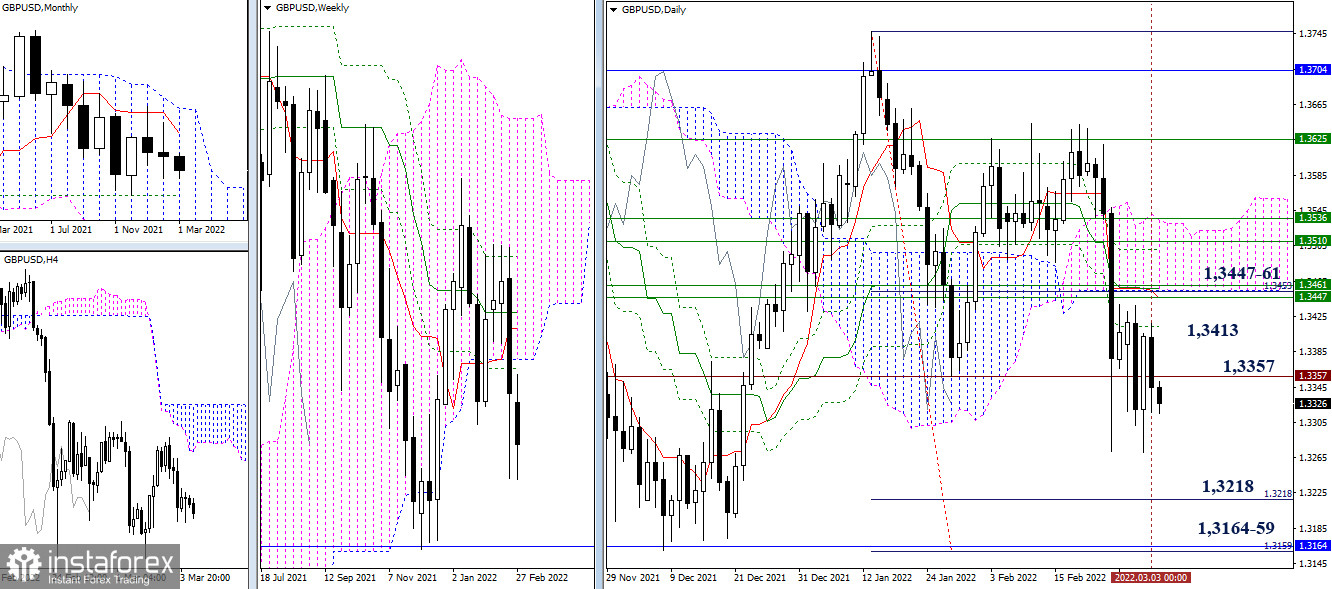
Neither bears nor bulls manage to demonstrate a directional movement, lasting at least a couple of days. As a result, we observe the development of consolidation, with the center located in the region of the lowest extremum of the past (1.3357). For bears, the reference points located at 1.3218 - 1.3164 - 1.3159 (monthly Fibo Kijun + daily target for the breakdown of the Ichimoku cloud) remain important. For bulls, the nearest resistances are in the zone of accumulation of weekly and daily levels (1.3447-61). The resistance in the upper consolidation area has been provided by the daily Fibo Kijun (1.3413) in recent days.

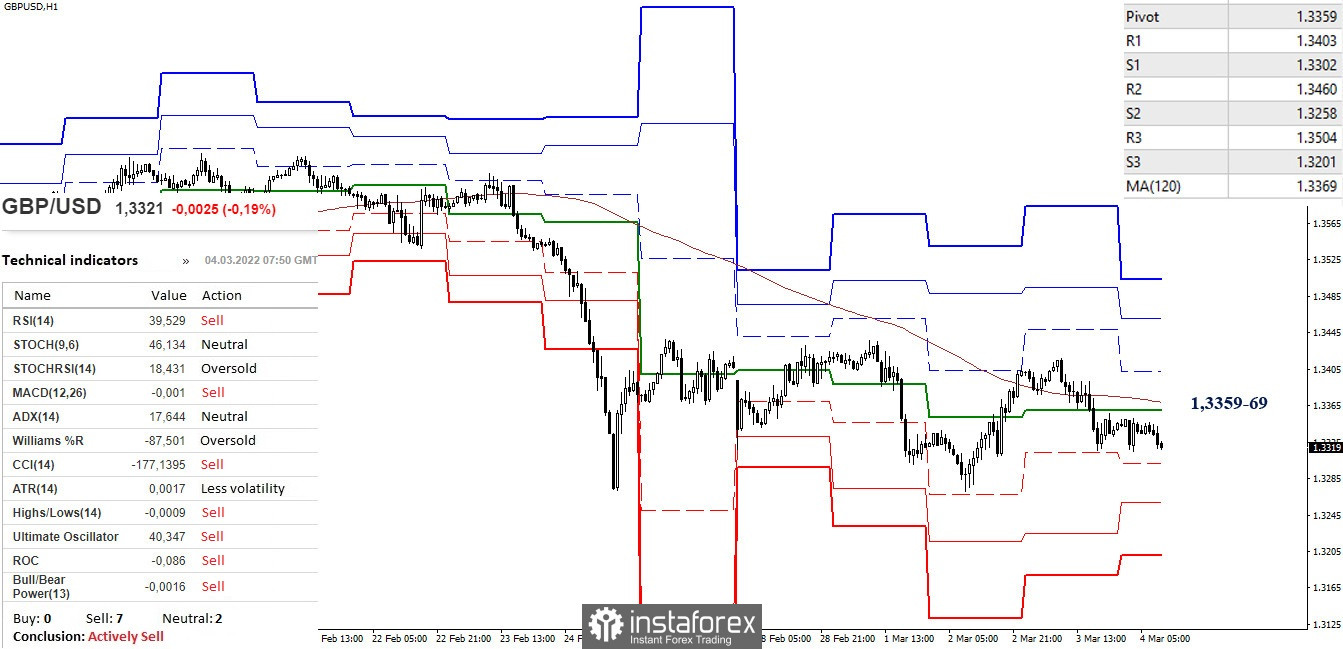
Consolidation of the daily timeframe contributes to the development of the sideways movement in the lower timeframes. The center of sideways movement today tends to be the key levels that combine their efforts in the area of 1.3359-69 (central pivot point + weekly long-term trend). Other reference points for intraday movement are currently located at 1.3302 - 1.3258 - 1.3201 (classic pivot points support) and at 1.3403 - 1.3460 - 1.3504 (classic pivot points resistance).
***
Kinko Hyo (9.26.52) and Kijun-sen levels in the higher time frames, as well as Classic Pivot Points and Moving Average (120) on the H1 chart, are used in the technical analysis of the trading instruments.
 English
 Русский
 Bahasa Indonesia
 Bahasa Malay
 ไทย
ไทย Español
 Deutsch
 Български
 Français
 Tiếng Việt
 中文
中文 বাংলা
বাংলা हिन्दी
 Čeština
 Українська
 Română

