GBP/USD
Analysis:
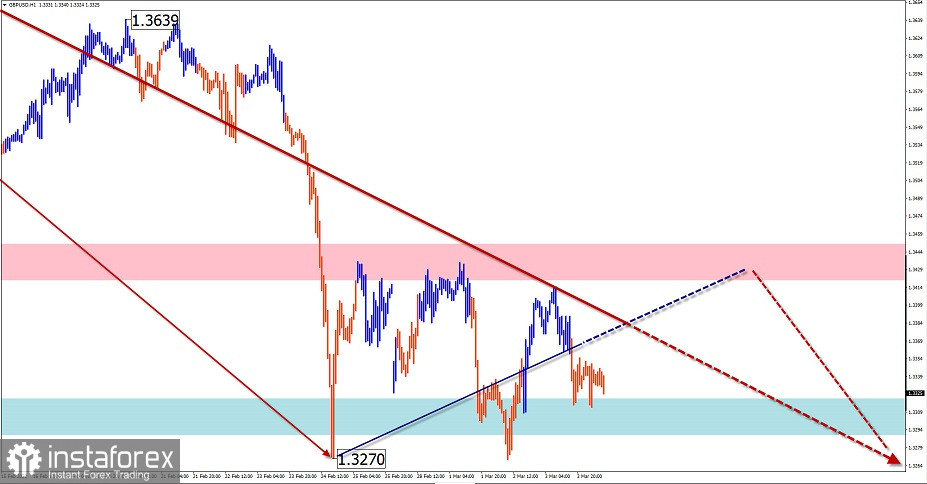
The greatest interest in the major market of the British pound is the downward wave from January 13. Since February 24, a correction plane has been formed in its structure, which has not been completed yet.
Forecast:
On the next day, the general lateral mood of the pair's movement is expected to continue. After the probable pressure on the support zone, we can expect a change in the vector and a rise in the price to the upper limit of the price corridor.
Potential reversal zones
Resistance:
- 1.3420/1.3320
Support:
- 1.3320/1.3290
Recommendations:
Today, short-term purchases of the British pound with a reduced lot from the support zone are possible. It is worth considering the limited potential of the upcoming price growth. The optimal tactic would be to refrain from entering the market until the signals for sale appear in the area of the resistance zone.

AUD/USD
Analysis:
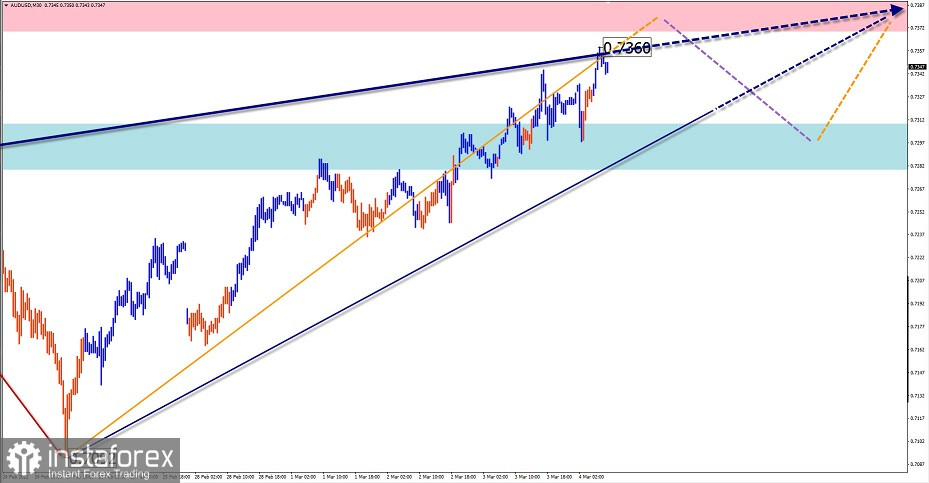
On the Australian dollar market, the formation of an upward wave from January 28 continues. The price growth of recent days has brought the pair's quotes to the area of a strong potential reversal zone on a weekly scale. Before the wave continues to grow, it is necessary to accumulate the potential for correction.
Forecast:
On the current day, the pair's price movement is expected to move mainly to the side plane. After the pressure on the resistance zone in the first half of the day, you can expect a reversal and the beginning of a decline.
Potential reversal zones
Resistance:
- 0.7370/0.7400
Support:
- 0.7310/0.7280
Recommendations:
There are no conditions for trade deals in the Australian dollar market today. The growth potential has been exhausted. Conditions have not been formed for the sale.

USD/CHF
Analysis:
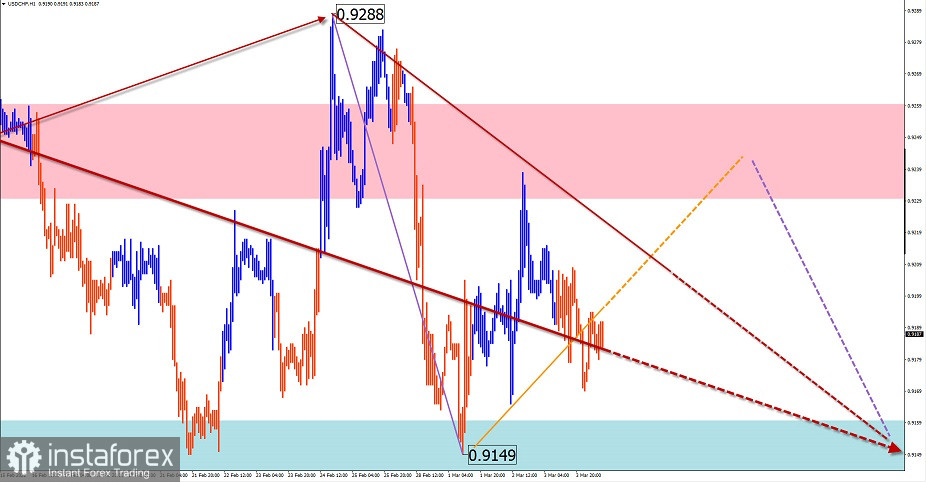
The formation of a horizontal descending plane has been continuing on the Swiss Franc chart since last summer. The analysis of its structure shows the formation of the final section (C).
Forecast:
During the next trading sessions, the general flat mood of the movement is expected. After the probable pressure on the support zone, then you can wait for a change of direction and a rise in the course to the resistance zone.
Potential reversal zones
Resistance:
- 0.9230/0.9200
Support:
- 0.9160/0.9130
Recommendations:
On the next day, short-term "pipsing" transactions in fractional lots are possible on the Swiss franc market. Purchases will become possible after the appearance of confirmed signals in the area of the support zone.

USD/CAD
Analysis:
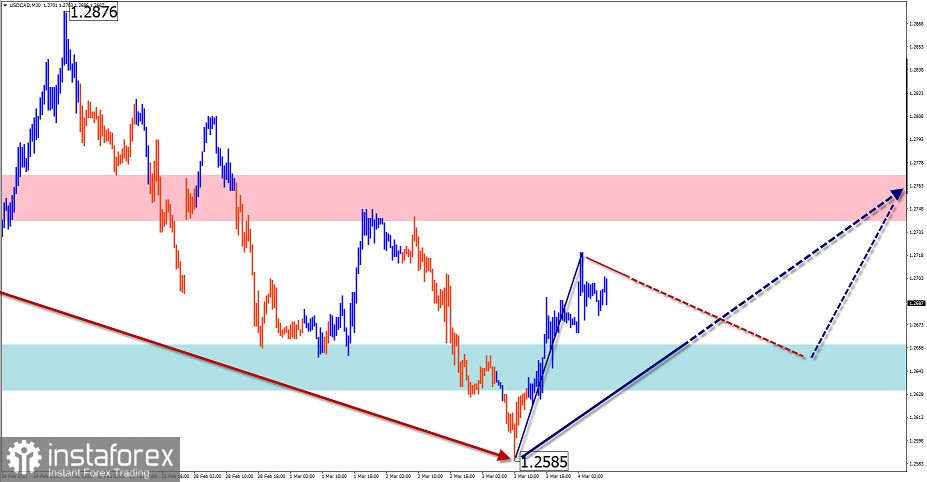
The direction of the trend of the Canadian dollar major is set by the upward wave from May 18 last year. The unfinished wave started on January 13. Within its framework, a correction in the form of a stretched plane has been formed since the beginning of February. The ascending section from March 3 has a reversal potential.
Forecast:
In the near future, a predominantly sideways course of price movement is expected in the corridor between the nearest oncoming zones. In the first half of the day, you can expect a general downward vector. A change of direction is likely at the end of the day or tomorrow.
Potential reversal zones
Resistance:
- 1.2740/1.2770
Support:
- 1.2660/1.2630
Recommendations:
Today, it is better to limit trading activity on the Canadian market to short-term transactions using a small lot. For purchases, track the reversal signals in the support area.

Explanations: In the simplified wave analysis (UVA), waves consist of 3 parts (A-B-C). The last incomplete wave is analyzed. The solid background of the arrows shows the formed structure, and the dotted one shows the expected movements.
Attention: The wave algorithm does not take into account the duration of the movements of the instrument in time!
 English
 Русский
 Bahasa Indonesia
 Bahasa Malay
 ไทย
ไทย Español
 Deutsch
 Български
 Français
 Tiếng Việt
 中文
中文 বাংলা
বাংলা हिन्दी
 Čeština
 Українська
 Română

