GBP/USD 5M

The GBP/USD currency pair also performed a powerful fall on Thursday, which happened due to the geopolitical situation in Ukraine. The pound has fallen for the same reason as the European currency. In fact, it was not the euro or the pound that was falling, it was the US dollar that was growing, as demand for it was growing in a "dangerous time" for investors and traders. Thus, there is no point even considering macroeconomic statistics or Thursday's fundamental background. Especially when you consider that there were practically none. Now the pair will be completely at the mercy of the geopolitical background. The European Union and the United States have already imposed new sanctions against Russian banks and the industrial sector, after which the shares of Russian companies have further collapsed. Now it is quite possible that Moscow will answer next. Unfortunately, these mutual responses do nothing to improve either the geopolitical situation or the situation on world markets.
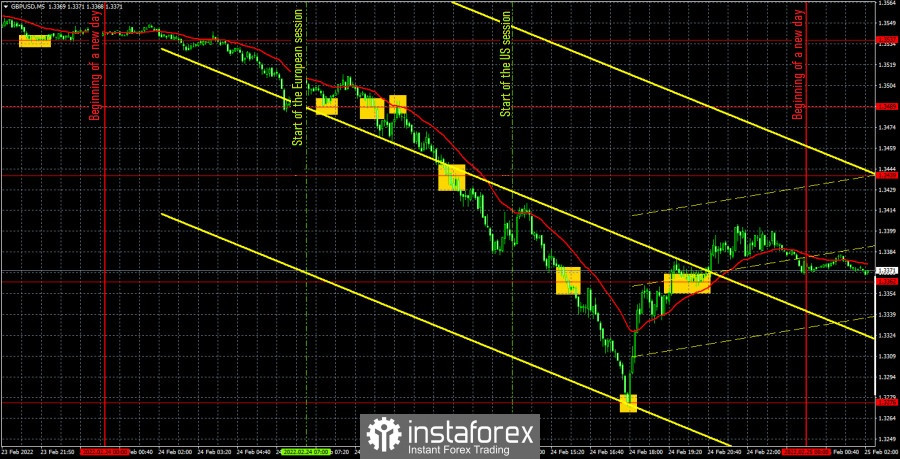
As for trading signals, today was almost perfect for traders with the condition that all buy signals should be ignored. We have previously said why. It turns out that the first trading signal for short positions was formed when the price settled below the extreme level of 1.3489, and in the future the price simply overcame each next level until it reached 1.3276, from which it performed a very clear rebound. Short positions should have been closed on this rebound. The profit on them could be 180 points. The rebound from the level of 1.3276 should no longer be worked out, since all buy signals should be ignored. Despite the fact that after this rebound, a strong upward movement has already begun.
COT report:

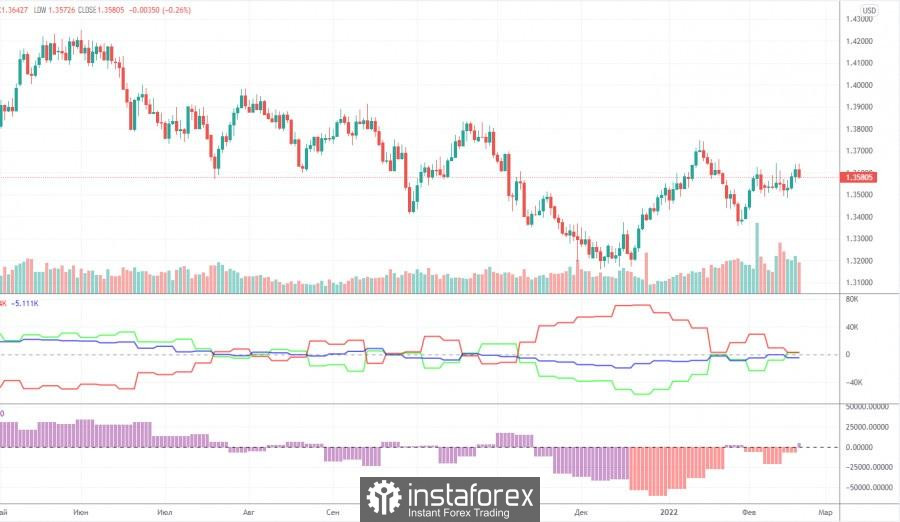
The latest Commitment of Traders (COT) report on the British pound showed an increase in bullish sentiment among professional traders. For the first time in several months, the number of long positions from the non-commercial group exceeded the number of short positions, so we can assume that the annual downward trend is over. In principle, the situation with COT reports on the pound is very similar to the situation on the euro. There, too, major players are increasing long positions, but at the same time the euro continues to be very close to its annual lows and in fact is not growing. But the pound, as we have repeatedly said, shows a smaller drop against the dollar and is growing more confidently. At the moment, it is at a much greater distance from its annual lows, so we believe that if there is a new fall, the pound will fall less than the euro. If there is a new growth, the pound will grow stronger than the euro. This is now explained by the fact that against the background of the planned multiple increases in the Federal Reserve's key rate in 2022, the European Central Bank simply refuses to raise its rate, and the Bank of England has already raised it twice. Thus, due to this discrepancy in the rates for tightening monetary policy, the pound occupies a more advantageous position in comparison with the euro currency. Moreover, non-commercial traders have just recently been bearish about the pound, which is eloquently shown by the green line of the first indicator or the second indicator in the chart above. However, it is over the past couple of months that their mood has become much more bullish.
We recommend to familiarize yourself with:
Overview of the EUR/USD pair. February 25. The foreign exchange market has collapsed. And not just it. A war has started between Ukraine and Russia.
Overview of the GBP/USD pair. February 25. Boris Johnson calls on Europe to abandon Russian gas and oil.
Forecast and trading signals for EUR/USD on February 25. Detailed analysis of the movement of the pair and trading transactions.
GBP/USD 1H

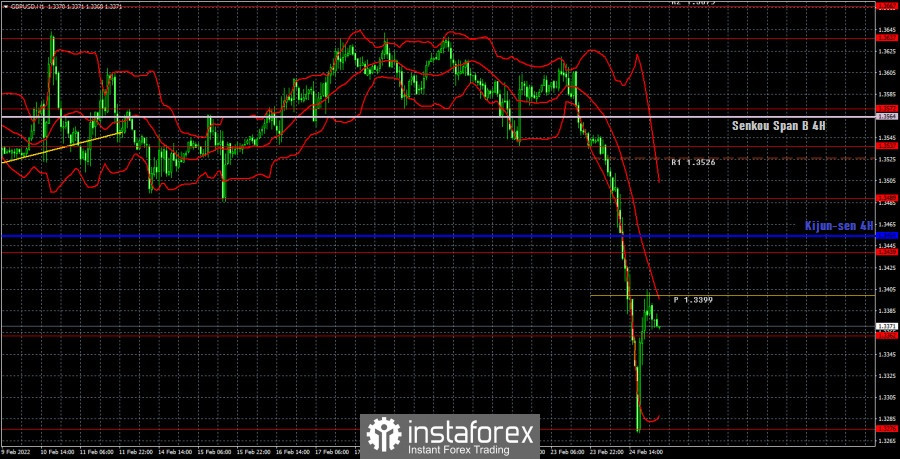
The technical picture on the hourly timeframe has changed dramatically in just a day. The pair fell by 300 points, and then immediately rose by 130. The market is in a state of shock from what is happening in Ukraine and simply cannot control itself. Therefore, in the coming days, the pair may move very volatile and in any direction. There is no trend now. Traders are reacting to geopolitics. We highlight the following important levels on February 25: 1.3170-1.3185, 1.3276, 1.3362, 1.3439, 1.3489, 1.3537, 1.3572. The Senkou Span B (1.3564) and Kijun-sen (1.3454) lines can also be signal sources. Signals can be "bounces" and "breakthroughs" of these levels and lines. It is recommended to set the Stop Loss level to breakeven when the price passes in the right direction by 20 points. The lines of the Ichimoku indicator can move during the day, which should be taken into account when determining trading signals. There are also support and resistance levels on the chart that can be used to take profits on transactions. Not a single important event is scheduled for Friday in the UK, and there will be several not-so-important publications in the United States. We believe that there will be no reaction to the macroeconomics, even if it is strong. The dollar definitely does not need support now and it will become more expensive in the event of a deterioration in the geopolitical situation. However, the pair can move very fast and very strongly. It will be very problematic to catch the necessary movements. You need to be cautious and trade carefully.
Explanations for the chart:
Support and Resistance Levels are the levels that serve as targets when buying or selling the pair. You can place Take Profit near these levels.
Kijun-sen and Senkou Span B lines are lines of the Ichimoku indicator transferred to the hourly timeframe from the 4-hour one.
Support and resistance areas are areas from which the price has repeatedly rebounded off.
Yellow lines are trend lines, trend channels and any other technical patterns.
Indicator 1 on the COT charts is the size of the net position of each category of traders.
Indicator 2 on the COT charts is the size of the net position for the non-commercial group.
 English
 Русский
 Bahasa Indonesia
 Bahasa Malay
 ไทย
ไทย Español
 Deutsch
 Български
 Français
 Tiếng Việt
 中文
中文 বাংলা
বাংলা हिन्दी
 Čeština
 Українська
 Română

